
Abstract
BACKGROUND/AIMS
Schizophrenia is a complex neuropsychiatric disorder marked by diverse structural brain abnormalities and clinical heterogeneity. Auditory verbal hallucinations (AVH), a hallmark symptom of the disorder, are thought to involve disruptions in limbic, paralimbic, and cortical circuits. While volumetric and cortical thickness alterations have been extensively investigated, the interplay between brain morphometry, symptom severity, and demographic variables remains incompletely understood. This study aims to investigate differences in cortical and subcortical structures among patients with schizophrenia who do and do not experience auditory hallucinations, and healthy control participants.
MATERIALS AND METHODS
Structural magnetic resonance imaging data were derived from the publicly accessible OpenNeuro repository (accession: ds004302), which contains pre-existing T1-weighted images acquired from adults with schizophrenia and healthy controls under standardized protocols. The analytic sample consisted of 46 patients with schizophrenia (23 with AVH and 23 without) and 41 age- and sex-matched healthy controls, all aged 18-65 years. High-resolution images were processed using the vol2Brain automated segmentation pipeline to extract cortical thickness and subcortical volumetric metrics across more than one hundred anatomically defined regions. Group differences were assessed using Mann-Whitney U and independent-samples t-tests, and associations between structural measures and clinical or demographic variables (including hallucination severity, age, sex, and intelligence quotient) were examined using Pearson’s correlations.
RESULTS
Compared to healthy controls, schizophrenia patients exhibited widespread reductions in regional brain volumes, particularly in temporal and thalamic regions. Sex-based analyses revealed significantly larger global and regional volumes in males across both the full sample and the schizophrenia subgroup. Notably, greater AVH severity was associated with lower volumes of the basal forebrain and the posterior cingulate cortex, and with increased volume of the superior frontal gyrus. Cortical thickness differences were more limited, but revealed age-related reductions and significant associations with symptom severity. Correlation analyses highlighted robust associations between age, sex, and key neuroimaging metrics, underlining the importance of demographic moderators.
CONCLUSION
The findings reinforce the notion that schizophrenia, and especially AVH symptomatology, is characterized by specific and clinically meaningful neuroanatomical alterations. Volumetric changes in limbic and frontal circuits appear particularly sensitive to both symptom severity and demographic context, supporting their role in AVH pathophysiology and the broader neurobiology of schizophrenia.
Keywords: Schizophrenia, auditory hallucinations, magnetic resonance imaging, brain volume, cortical thickness
INTRODUCTION
Schizophrenia is a chronic neurodevelopmental disorder characterized by disturbances in cognition, perception, and emotion; it affects approximately 1% of the global population and substantially impairs social and functional outcomes., Auditory verbal hallucinations (AVH)-perception of speech in the absence of external stimuli-occur in 60-80% of patients and reflect disruptions in internal speech monitoring and reality-testing processes.,
Advances in structural magnetic resonance imaging (MRI) have facilitated detailed examination of the neuroanatomical substrates of AVH. Morphometric studies frequently implicate regions within the auditory-language network, including the superior temporal gyrus and its planum temporale subregion, a core anatomical component of Wernicke’s area, as well as the insula and the anterior cingulate cortex., However, findings remain inconsistent due to methodological variability and heterogeneous symptom characterization.
Automated morphometric tools provide more standardized analyses; cortical thickness and subcortical volume measurements improve detection of subtle anatomical alterations in schizophrenia., Vol2Brain, a high-accuracy segmentation platform compatible with conventional neuroimaging tools, provides reliable volumetric and thickness outputs with enhanced processing efficiency.
In light of these considerations, the present study makes a distinct contribution by examining patients with schizophrenia, both with and without AVH, and healthy controls within a unified, methodologically consistent morphometric framework. Identical preprocessing and automated segmentation procedures were applied across all participants to reduce heterogeneity, while sex-stratified analyses and graded hallucination severity enabled a more differentiated characterization of neuroanatomical variation. This multidimensional approach addresses longstanding limitations in the literature and supports a more integrated structural perspective necessary for clarifying how hallucinations arise and vary among individuals with schizophrenia.
This study aims to investigate cortical and subcortical differences among patients with schizophrenia (with and without AVH) and healthy controls, using vol2Brain-based morphometric analysis.
MATERIALS AND METHODS
Participants
This study utilized openly available neuroimaging and clinical data from the OpenNeuro repository (accession number ds004302), accessed on January 22, 2025. The dataset contains pre-existing T1-weighted MRI scans and accompanying demographic and clinical information acquired as part of the original study. The full sample includes 87 individuals: 46 patients with schizophrenia (20 females and 26 males) and 41 healthy controls (19 females and 22 males). Patients were further categorized according to the presence or absence of AVH (23 AVH+ and 23 AVH−). All demographic, diagnostic, and symptom-related data were obtained directly from the dataset documentation; no additional clinical assessments were performed by the authors. Participants in the original dataset were right-handed, aged 18-65 years, and matched across groups for age, sex, and education.
According to the dataset documentation, schizophrenia diagnoses were established by the original investigators based on Diagnostic and Statistical Manual of Mental Disorders-5 (DSM-5) criteria and confirmed using the Structured Clinical Interview for DSM-5 Disorders, administered by licensed psychiatrists and clinically trained psychologists. The same source reports exclusion criteria, including major neurological disorders, traumatic brain injury with loss of consciousness, comorbid psychiatric conditions, substance use disorders within the past year, and an estimated intelligence quotient (IQ) below 70. According to the documentation accompanying the OpenNeuro dataset and its source publication, exclusion criteria included the presence of substance use disorders within the past year. The original investigators did not provide information regarding substance use beyond this period, nor did the dataset include any variables related to smoking status or smoking cessation. As these data were not collected or reported in the source study, the potential effects of long-term substance use or smoking-related volumetric variation could not be evaluated in the present analysis. Healthy controls were screened by the original research team to confirm the absence of psychiatric or neurological disorders and were not taking psychotropic medications, except for occasional use of sedatives.
The dataset also includes behavioral measures collected by the original investigators to characterize hallucination severity. In the AVH+ subgroup, a brief tapping paradigm was used in which participants indicated the occurrence of hallucinations during a quiet five-minute interval. These procedures were part of the primary study and were not administered or modified by the present authors.
Ethical Considerations
This study was conducted in accordance with the ethical principles of the Declaration of Helsinki. Ethical approval for secondary data analysis was obtained from the Kafkas University Faculty of Medicine Research Ethics Committee (approval number: 2025/04/10, date: 30.04.2025). The analysis was performed at Kastamonu University Faculty of Medicine, Department of Anatomy. As the dataset is anonymized and publicly accessible, no additional participant consent was required. An external psychiatrist reviewed the manuscript for general scientific clarity, but was not involved in the study design, clinical assessment, or data interpretation.
Magnetic Resonance Imaging Acquisition
The MRI data were obtained from the publicly available OpenNeuro repository (accession: ds004302) and were originally acquired on a 3-T Philips Ingenia scanner, using a T1-weighted Fast Field Echo sequence with 1-mm isotropic resolution. Acquisition parameters (TR =9.90 ms, TE =4.60 ms, flip angle =8°) followed the dataset’s standardized morphometry Protocol. All scans underwent quality control by the dataset providers, and images with motion or acquisition artifacts were excluded before public release.
Image Processing and Morphometric Analysis
T1-weighted scans were processed using vol2Brain, an open-access, fully automated pipeline for brain morphometry. The processing workflow includes bias field correction, spatial normalization to the MNI152 stereotactic space, tissue segmentation into gray matter (GM), white matter (WM), cerebrospinal fluid (CSF), and intracranial volume (ICV), followed by multi-atlas label fusion to segment more than 100 cortical and subcortical brain structures with high anatomical accuracy. Segmentation outputs generated by this workflow are visualized in . Because volumetric quantification depends directly on how segmented structures are defined anatomically, the key volumetric reference definitions are outlined below.
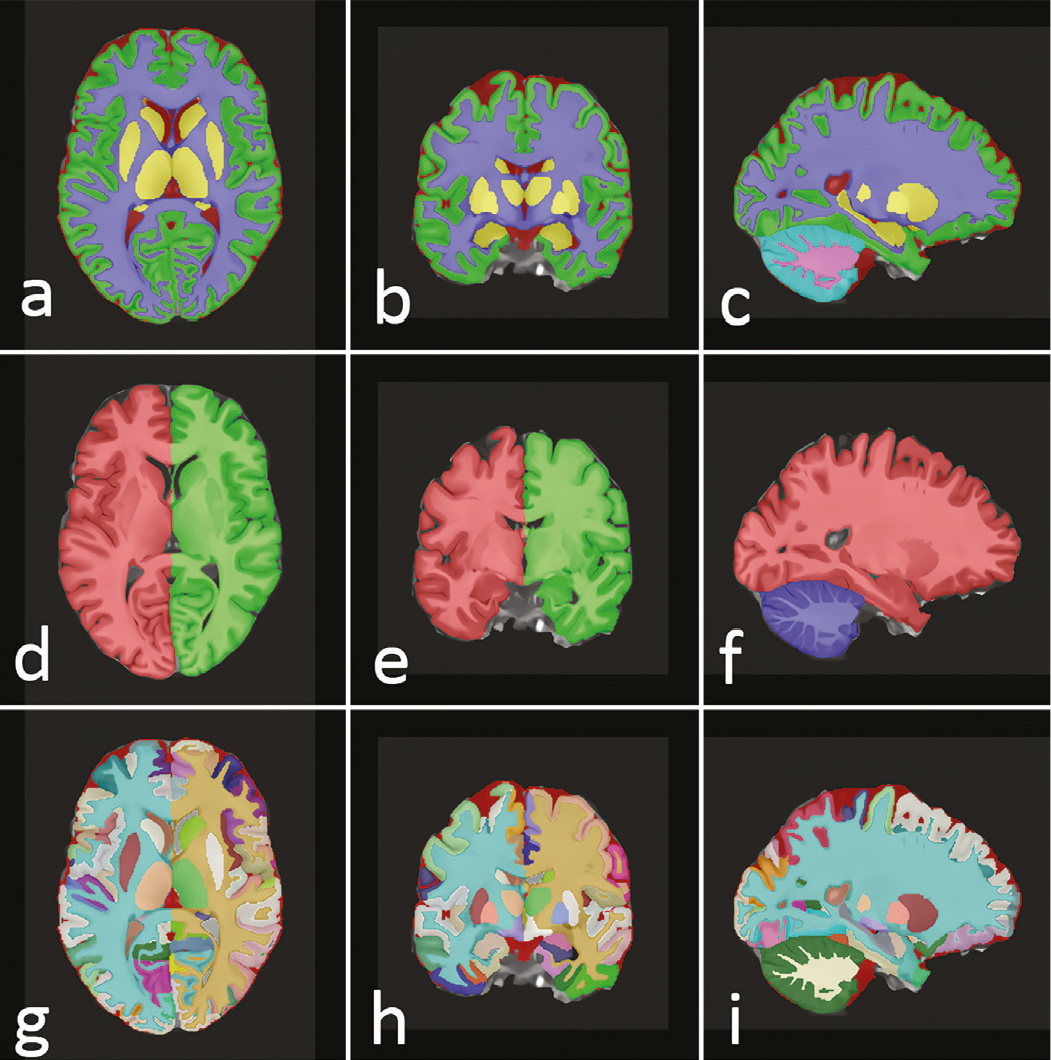
This figure presents representative radiological images generated during the automated preprocessing and segmentation workflow applied to all participants. Panels (a-c) show axial, coronal, and sagittal views after full multi-atlas brain parcellation, with each cortical and subcortical structure rendered in a distinct color to illustrate anatomical boundaries used for volumetric extraction. Panels (d-f) display the hemisphere-level cortical segmentation, highlighting left-right separation used for calculating hemispheric volumes, asymmetry indices, and region-specific cortical thickness estimates. Panels (g-i) provide detailed axial, coronal, and sagittal views of the high-resolution cortical parcellation, demonstrating the fine-grained labeling of gyri, sulci, and subcortical nuclei that form the basis of regional morphometric measurements.
Across all panels, the color-coded masks correspond directly to the regions included in statistical analyses, ensuring that the volumetric and cortical-thickness values derive from anatomically standardized, visually verifiable boundaries. These examples allow readers to understand how structural measurements were obtained in a reproducible manner and how each anatomical region was delineated in the final dataset.
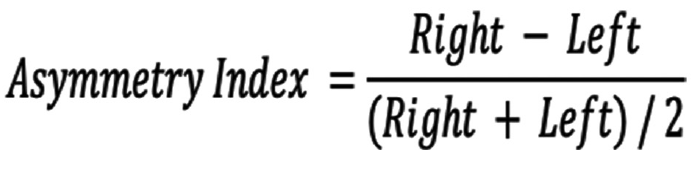
In accordance with vol2Brain’s anatomical framework, ICV was defined as the total volume enclosed by the inner table of the skull, including brain tissue, meninges, and CSF spaces, bounded superiorly by the dura mater, and excluding extracranial structures. Total brain volume was defined as the combined gray and WM of the cerebrum and cerebellum, excluding ventricular CSF. These radiologically derived measures adhere to standard conventions in structural MRI morphometry and enable normalized comparisons across individuals. Vol2Brain provides both volumetric and cortical-thickness outputs; volumes are reported in cubic centimeters (cm³) and normalized to ICV (ICV%). Cortical thickness is expressed in millimeters, and asymmetry indices for bilateral structures are calculated using the formula
Regions of Interest
The analysis included a wide range of anatomical regions. Vol2Brain segmented subcortical regions in accordance with the standard multi-atlas labeling scheme, including the nucleus accumbens, amygdala, basal forebrain, caudate nucleus, hippocampus, pallidum, thalamus, and ventral diencephalon. Macrostructural volumes of the cerebrum, cerebellum, and brainstem were also recorded.
Cortical volumes and thickness were assessed in the frontal, temporal, parietal, occipital, and limbic lobes, including specific gyri and subregions, namely the superior, middle, and inferior frontal gyri, planum temporale, Heschl’s gyrus, insula (anterior and posterior), cingulate cortex (anterior, middle, and posterior), fusiform gyrus, precuneus, angular gyrus, supramarginal gyrus, parahippocampal gyrus, and entorhinal cortex.
Cerebellar structures, including the cerebellar hemispheres, vermis lobules I-X, and the fourth ventricle, as well as ventricular CSF compartments, were also included in the output. All output values were assessed against age- and sex-adjusted normative ranges, and deviations were automatically flagged by the system.
Segmentation was performed in the neurological orientation, and all outputs were exported in both PDF and XLS formats. To maintain methodological consistency and objectivity, no manual corrections were applied to the automated outputs.
Statistical Analysis
Statistical analyses were performed using IBM SPSS Statistics 22.0 (IBM Corp., Armonk, NY, USA). Before hypothesis testing, all variables were examined for missing data, outliers, and adherence to distributional assumptions. Normality was assessed with the Shapiro-Wilk test and supported by inspection of histograms and Q-Q plots. Descriptive statistics were presented as mean ± standard deviation for normally distributed measures.
Group differences in volumetric and cortical thickness parameters between patients with schizophrenia and healthy controls were evaluated using Independent Samples t-tests, with Levene’s test applied to assess homogeneity of variance. A two-tailed p-value <0.05 was considered statistically significant.
To investigate the effect of hallucination severity, patients were classified into mild (0-10), moderate (11-25), and severe (≥26) groups based on Psychotic Symptom Rating Scales (PSYRATS) auditory hallucination scores. One-way ANOVA was used to compare neuroimaging measures across these groups, and Tukey’s HSD was applied when significant main effects were detected.
Sex-based analyses were conducted using Independent Samples t-tests across three contexts: the full sample, the schizophrenia group, and the hallucination-positive subgroup. These comparisons focused on brain regions identified as significant in prior analyses.
Pearson correlation analyses were used to assess associations between continuous clinical variables (PSYRATS score, illness duration, IQ) and selected structural measures. Only participants with complete datasets were included; no exclusions were made unless values clearly reflected segmentation errors or data-entry issues.
RESULTS
Multiple statistically significant structural differences were identified across comparisons by diagnosis, sex, and hallucination severity. All significant results are presented in to ensure transparency and reproducibility. In the sections that follow, only statistically significant findings deemed primarily relevant to the clinical focus of the study are summarized; all additional significant parameters are available in the corresponding tables.
Table 1. Group differences in brain volume and cortical thickness between patients with schizophrenia and healthy controls
Neuroanatomical region | Mean ± SD (HC, n=41) | Mean ± SD (SCH, n=46) | t | p |
|---|---|---|---|---|
MTG right (cm³) | 16.852±1.431 | 14.992±1.856 | 4.697 | 0.0000 |
Pallidum right | 0.082±0.017 | 0.099±0.017 | -3.940 | 0.0003 |
MTG total (cm³) | 32.339±2.790 | 29.464±3.592 | 3.739 | 0.0004 |
Ent total thickness (mm) | 3.754±0.146 | 3.602±0.201 | 3.672 | 0.0005 |
MSFG right (cm³) | 7.717±1.295 | 6.576±1.091 | 3.739 | 0.0005 |
Thalamus right (cm³) | 5.873±0.591 | 5.269±0.799 | 3.621 | 0.0006 |
Temporal right (cm³) | 64.192±5.981 | 58.709±6.281 | 3.625 | 0.0007 |
MTG right | 1.149±0.101 | 1.064±0.083 | 3.594 | 0.0009 |
MSFG right | 0.523±0.063 | 0.467±0.065 | 3.511 | 0.0009 |
Thalamus total (cm³) | 11.918±1.195 | 10.818±1.434 | 3.448 | 0.0011 |
ITG right (cm³) | 13.601±1.788 | 12.164±1.507 | 3.413 | 0.0014 |
MSFG total (cm³) | 14.734±2.609 | 12.686±1.959 | 3.435 | 0.0014 |
TMP left (cm³) | 10.554±1.557 | 9.263±1.512 | 3.374 | 0.0015 |
Temporal total (cm³) | 125.893±1.752 | 115.996±12.154 | 3.349 | 0.0015 |
ITG total (cm³) | 26.901±3.186 | 24.384±2.636 | 3.373 | 0.0016 |
Pallidum total | 0.156±0.037 | 0.186±0.032 | -3.358 | 0.0016 |
SMC total (cm³) | 11.739±1.719 | 10.417±1.359 | 3.323 | 0.0019 |
OrIFG left thickness (mm) | 2.869±0.444 | 2.519±0.417 | 3.239 | 0.0022 |
CO total (cm³) | 9.145±1.155 | 8.254±1.014 | 3.242 | 0.0023 |
PP left thickness (mm) | 2.442±0.452 | 2.069±0.499 | 3.194 | 0.0023 |
This table summarizes statistically significant differences in brain volume and cortical thickness between patients with schizophrenia and healthy controls, based on Independent Samples t-tests. All values are reported as mean ± standard deviation, and only comparisons with p<0.05 are included.
Independent Samples t-tests were conducted between healthy controls (HC) and patients with schizophrenia (SCH = AVH− + AVH+). Values are presented as mean ± standard deviation. Only statistically significant results are shown (p<0.05).
MTG: Middle temporal gyrus, ITG: Inferior temporal gyrus, MSFG: Medial superior frontal gyrus, TMP: Temporal pole, SMC: Supplementary motor cortex, OrIFG: Orbital inferior frontal gyrus, CO: Central operculum, PP: Planum polare, SD: Standard deviation, SCH: Schizophrenia, AVH: Auditory verbal hallucinations.
Table 2. Sex differences in neuroanatomical structure across the entire sample
Neuroanatomical region | Mean ± SD (F, n=39) | Mean ± SD (M, n=48) | t | p |
|---|---|---|---|---|
POrG left (cm³) | 2.946±0.327 | 3.486±0.423 | 5.602 | 0.0000 |
POrG total (cm³) | 5.814±0.555 | 6.748±0.821 | 5.410 | 0.0000 |
Caudate right (cm³) | 3.383±0.222 | 3.772±0.381 | 5.265 | 0.0000 |
Amygdala left (cm³) | 0.920±0.097 | 1.070±0.151 | 4.852 | 0.0000 |
Cerebellum right (cm³) | 67.389±5.631 | 74.955±5.520 | 4.949 | 0.0000 |
PHG total (cm³) | 5.883±0.663 | 6.763±0.592 | 4.994 | 0.0000 |
Caudate total (cm³) | 6.785±0.472 | 7.473±0.766 | 4.499 | 0.0000 |
Amygdala total (cm³) | 1.877±0.206 | 2.147±0.212 | 4.762 | 0.0000 |
FuG total (cm³) | 15.159±1.263 | 16.953±1.975 | 4.453 | 0.0001 |
Cuneus total (cm³) | 7.945±0.956 | 9.282±1.475 | 4.413 | 0.0001 |
PHG right (cm³) | 2.867±0.294 | 3.245±0.318 | 4.617 | 0.0001 |
Cerebellum total (cm³) | 134.819±11.199 | 148.844±10.419 | 4.671 | 0.0001 |
PHG left (cm³) | 3.016±0.406 | 3.518±0.337 | 4.717 | 0.0001 |
IOG total (cm³) | 11.692±1.505 | 13.552±1.477 | 4.553 | 0.0001 |
Intracranial cavity (cm³) | 1323.014±119.083 | 1465.823±99.100 | 4.578 | 0.0001 |
Cerebellar GM right (cm³) | 49.818±4.640 | 55.388±4.514 | 4.431 | 0.0001 |
FuG right (cm³) | 7.567±0.758 | 8.540±1.109 | 4.146 | 0.0002 |
Cerebellar GM total (cm³) | 107.445±9.711 | 118.657±9.027 | 4.307 | 0.0002 |
LiG total (cm³) | 16.307±1.713 | 18.346±1.980 | 4.190 | 0.0002 |
This table presents significant structural differences between male and female participants across the whole sample, including both schizophrenia patients and healthy controls. Mean ± standard deviation values are provided for each group, with p<0.05 indicating statistical significance.
Independent Samples t-tests were conducted between female and male participants. Values are presented as mean ± standard deviation. All measurements with p<0.05 are reported.
POrG: Parietal operculum gyrus, PHG: Parahippocampal gyrus, FuG: Fusiform gyrus, Cun/Cuneus: Cuneus, IOG: Inferior occipital gyrus, LiG: Lingual gyrus, GM: Gray matter, SD: Standard deviation.
Table 3. Sex-based structural brain differences among patients with schizophrenia
Neuroanatomical region | Mean ± SD (F, n=20) | Mean ± SD (M, n=26) | t | p |
|---|---|---|---|---|
Cerebellar GM right (cm³) | 47.897±3.299 | 55.061±3.989 | 5.792 | 0.0000 |
Cerebellar GM total (cm³) | 103.682±7.147 | 117.941±8.154 | 5.407 | 0.0001 |
ITG right (cm³) | 10.828±0.841 | 12.535±1.444 | 4.759 | 0.0001 |
Cerebellar GM left (cm³) | 47.160±3.403 | 53.764±4.137 | 5.168 | 0.0001 |
Intracranial cavity (cm³) | 1269.585±93.397 | 1444.398±83.492 | 5.354 | 0.0001 |
Amygdala left (cm³) | 0.889±0.084 | 1.059±0.169 | 4.386 | 0.0001 |
Inferior lateral ventricle left (cm³) | 0.082±0.058 | 0.241±0.203 | 4.118 | 0.0002 |
Cerebellum right (cm³) | 64.650±5.248 | 74.061±5.156 | 5.035 | 0.0002 |
Cuneus total (cm³) | 7.616±0.759 | 9.010±1.283 | 4.340 | 0.0002 |
MCgG right (cm³) | 4.720±0.462 | 5.558±0.755 | 4.348 | 0.0002 |
Occipital lobe left (cm³) | 32.832±2.581 | 37.372±3.409 | 4.565 | 0.0002 |
FuG total thickness (normalized) | 0.032±0.001 | 0.030±0.002 | -4.128 | 0.0002 |
PHG total (cm³) | 5.716±0.583 | 6.700±0.593 | 4.708 | 0.0003 |
POrG total (cm³) | 5.631±0.569 | 6.602±0.826 | 4.287 | 0.0003 |
CO right (cm³) | 3.579±0.423 | 4.280±0.440 | 4.605 | 0.0004 |
FuG total (cm³) | 14.795±1.061 | 16.789±2.219 | 3.993 | 0.0004 |
PHG left (cm³) | 2.913±0.351 | 3.494±0.352 | 4.626 | 0.0004 |
LiG left (cm³) | 7.599±0.664 | 8.735±1.038 | 4.173 | 0.0004 |
FuG right (cm³) | 7.258±0.703 | 8.500±1.280 | 4.033 | 0.0004 |
This table displays significant sex differences in brain volume and cortical thickness within the schizophrenia group. Group means are expressed as mean ± standard deviation, with comparisons reaching p<0.05.
Independent samples t-tests were conducted between female and male patients within the schizophrenia group. Values are presented as mean ± standard deviation. All measurements with p<0.05 are reported.
GM: Gray matter, ITG: Inferior temporal gyrus, PHG: Parahippocampal gyrus, POrG: Parietal operculum gyrus, FuG: Fusiform gyrus, CO: Central operculum, LiG: Lingual gyrus, MCgG: Middle cingulate gyrus, SD: Standard deviation.
Table 4. Brain volume and cortical thickness differences according to hallucination severity
Neuroanatomical region | Comparison | Mean ± SD (Moderate) | Mean ± SD (Severe) | Mean difference | p | 95% CI |
|---|---|---|---|---|---|---|
Amygdala total (cm³) | Mild (0-10) vs. Moderate (11-25) | 0.146±0.026 | 0.155±0.015 | 0.0273 | 0.0255 | [0.0031, 0.0515] |
Amygdala left (cm³) | Mild (0-10) vs. Moderate (11-25) | 0.074±0.021 | 0.076±0.009 | 0.0183 | 0.0408 | [0.0007, 0.0360] |
Basal forebrain total (cm³) | Mild (0-10) vs. Moderate (11-25) | 0.058±0.009 | 0.062±0.002 | 0.0086 | 0.0399 | [0.0004, 0.0169] |
Right middle precentral gyrus (cm³) | Mild (0-10) vs. Severe (26+) | 2.553±0.389 | 2.732±0.488 | 0.5686 | 0.0261 | [0.0624, 1.0748] |
Right middle precentral gyrus | Mild (0-10) vs. Moderate (11-25) | 0.179±0.027 | 0.198±0.033 | 0.0388 | 0.0354 | [0.0024, 0.0752] |
Right middle precentral gyrus | Mild (0-10) vs. Severe (26+) | 0.179±0.027 | 0.198±0.033 | 0.0391 | 0.0160 | [0.0069, 0.0714] |
Middle precentral gyrus asymmetry index | Mild (0-10) vs. Moderate (11-25) | -7.877±17.591 | 4.970±13.462 | 21.0425 | 0.0183 | [3.3311, 38.7540] |
Left middle temporal gyrus (cm³) | Moderate (11-25) vs. Severe (26+) | 14.875±1.532 | 13.551±1.946 | 2.2356 | 0.0398 | [0.0944, 4.3768] |
Left angular gyrus (cm³) | Moderate (11-25) vs. Severe (26+) | 9.184±0.987 | 8.691±1.351 | 1.8978 | 0.0375 | [0.0997, 3.6959] |
Middle postcentral gyrus asymmetry index | Mild (0-10) vs. Severe (26+) | 23.032±32.352 | -10.425±18.924 | -35.3593 | 0.0297 | [-67.5306, -3.1880] |
This table provides results from post-hoc comparisons among patients with mild, moderate, and severe auditory verbal hallucinations. Brain regions showing significant differences are listed, with data presented as mean ± standard deviation and significance determined by Tukey’s HSD post-hoc tests (p<0.05).
Post-hoc comparisons between hallucination severity levels were conducted using Tukey’s HSD test. Values are reported as mean ± standard deviation. Group labels: Mild (0-10), Moderate (11-25), Severe (26+).
CI: Confidence interval, SD: Standard deviation.
Group Comparison: Schizophrenia vs. Healthy Controls
Statistically significant volumetric and cortical thickness differences were identified between patients with schizophrenia and healthy controls. As presented in and , the schizophrenia group exhibited significantly lower volumes in the right middle temporal gyrus (MTG), inferior temporal gyrus (ITG), superior temporal gyrus, total temporal lobe, and bilateral thalami (p<0.001). Additional reductions were observed in medial prefrontal regions, including the right medial superior frontal gyrus (MSFG).
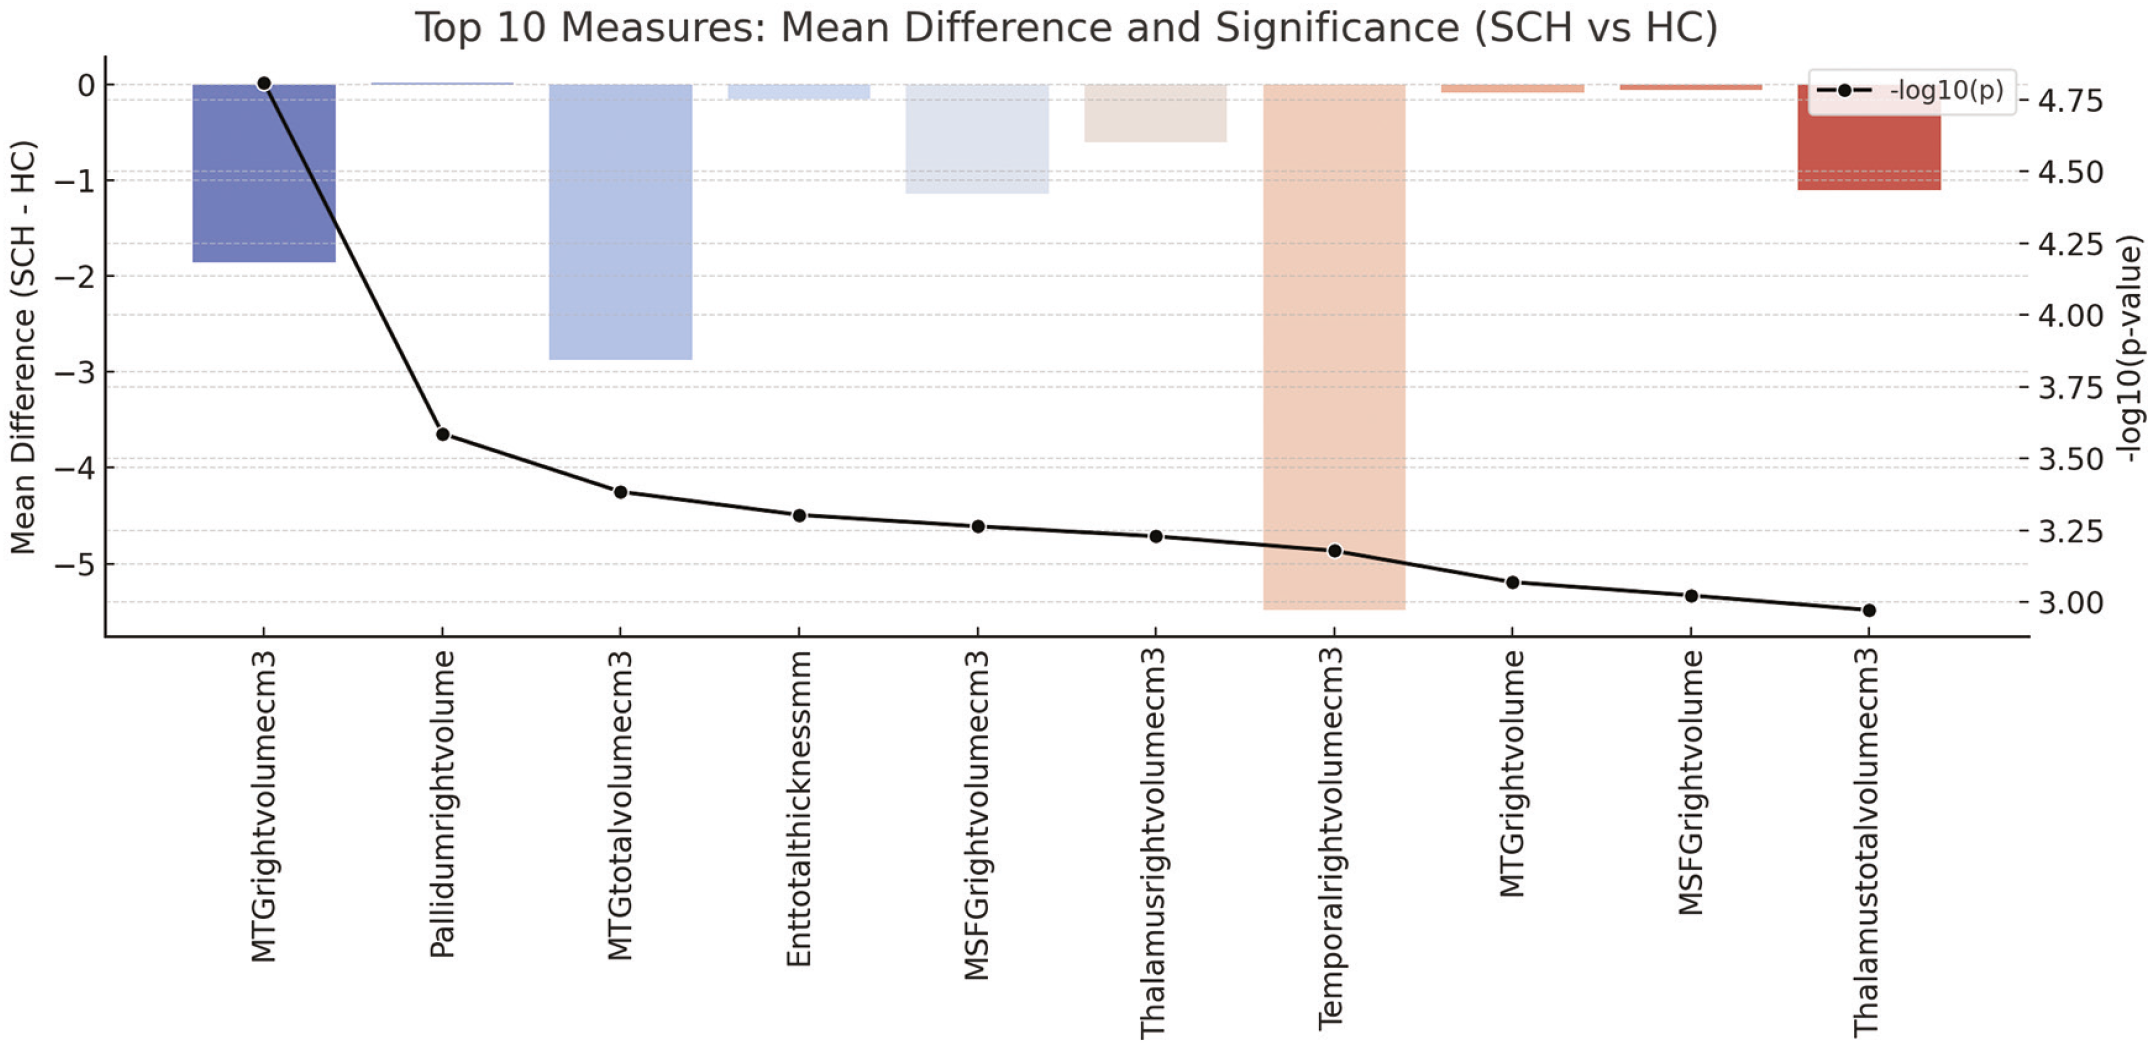
The figure displays the ten neuroanatomical regions with the largest mean volume differences between patients with schizophrenia (SCH) and healthy controls (HC), derived from the whole-brain automated segmentation. Each horizontal bar represents the absolute mean volume difference between groups for a given structure. On the right, statistical significance is shown on a base-10 logarithmic scale (-log10 of the p-value), indicated by the thin black vertical axis and its markers. Values around -3 on this scale correspond approximately to p ≈ 0.001, whereas values between about -3 and -4.7 indicate progressively stronger significance (for example, values close to -4.7 correspond to p levels in the order of 10-5). In this way, the plot simultaneously summarizes both the magnitude of the volumetric differences (bar length) and the strength of statistical evidence (position along the black significance axis) for each of the top-ranking regions.
These results indicate that the most prominent SCH-control volumetric differences cluster in temporal, limbic, and thalamic structures, consistent with established neuroanatomical models of the disorder. The high significance levels highlight that these differences are robust even after considering variability across individuals.
MTG: Middle temporal gyrus, MSFG: Medial superior frontal gyrus.
In contrast, significantly greater volumes were detected in several regions in the schizophrenia group, most prominently in the pallidum and selected cerebellar WM structures (p<0.005).
Significant reductions in cortical thickness were also recorded in limbic and orbitofrontal regions, including the entorhinal and orbitofrontal cortices (, ).
Sex-Based Differences in Brain Structure
Significant sex-related differences in brain morphology were identified across the entire sample. As presented in and , total intracranial, cerebellar, and parahippocampal volumes were significantly greater in males than in females (p<0.001). After stratification by diagnostic group, significant sex-related differences were also recorded within the schizophrenia subgroup, with larger volumes of cerebellar GM, hippocampus, and ventral diencephalon observed in males (, ).
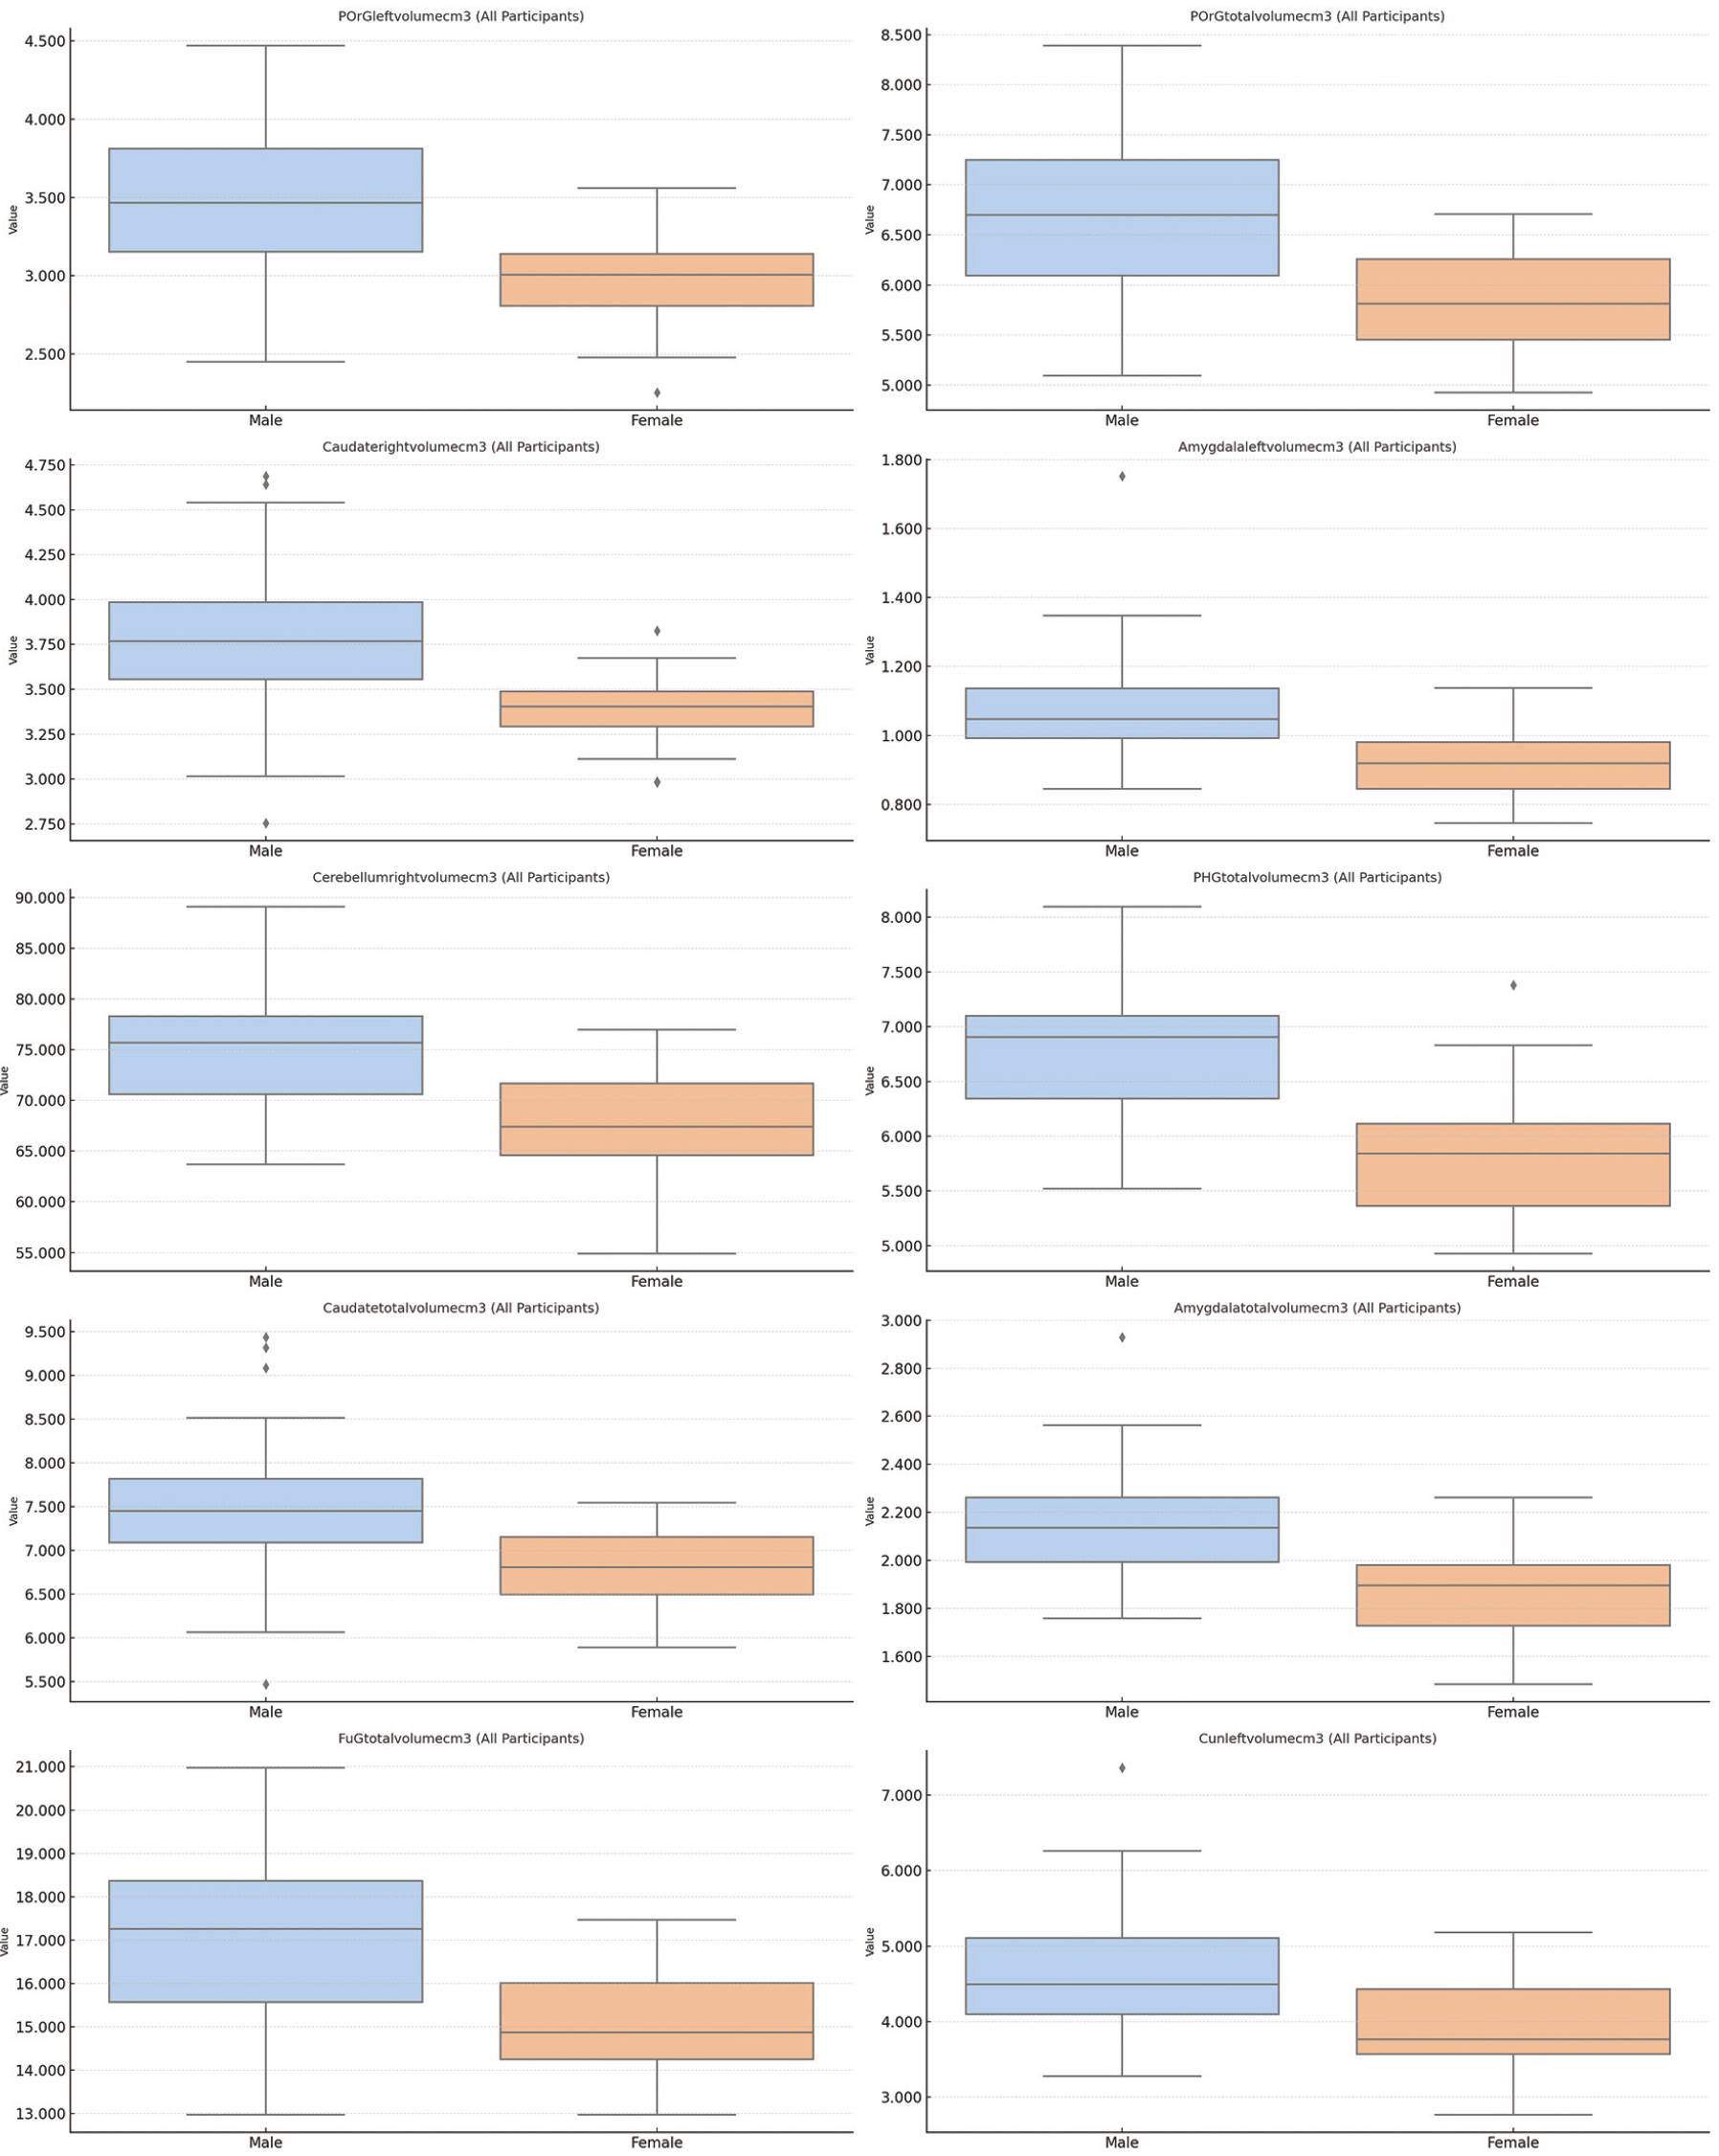
The figure presents boxplots illustrating sex-based distributions of ten brain structures that showed the largest volumetric differences across all participants. Each subplot depicts a single anatomical region, with separate boxplots for males (blue) and females (orange). For each region, the central horizontal line within the box corresponds to the median volume, the box boundaries represent the interquartile range, and the whiskers display the full data spread excluding outliers. Individual points beyond the whiskers indicate values outside the typical distribution. All volumetric measures are displayed on the y-axis using each region’s native unit (cm³), allowing direct comparison of overall distributional patterns. The consistent layout across subplots enables clear visualization of sex-related differences in central tendency and variability for each region.
The distributions show consistently larger volumes in males across multiple brain regions, reflecting well-established sex-related neuroanatomical scaling. This pattern confirms that sex exerts a strong, broad effect on brain structure independent of diagnostic status.
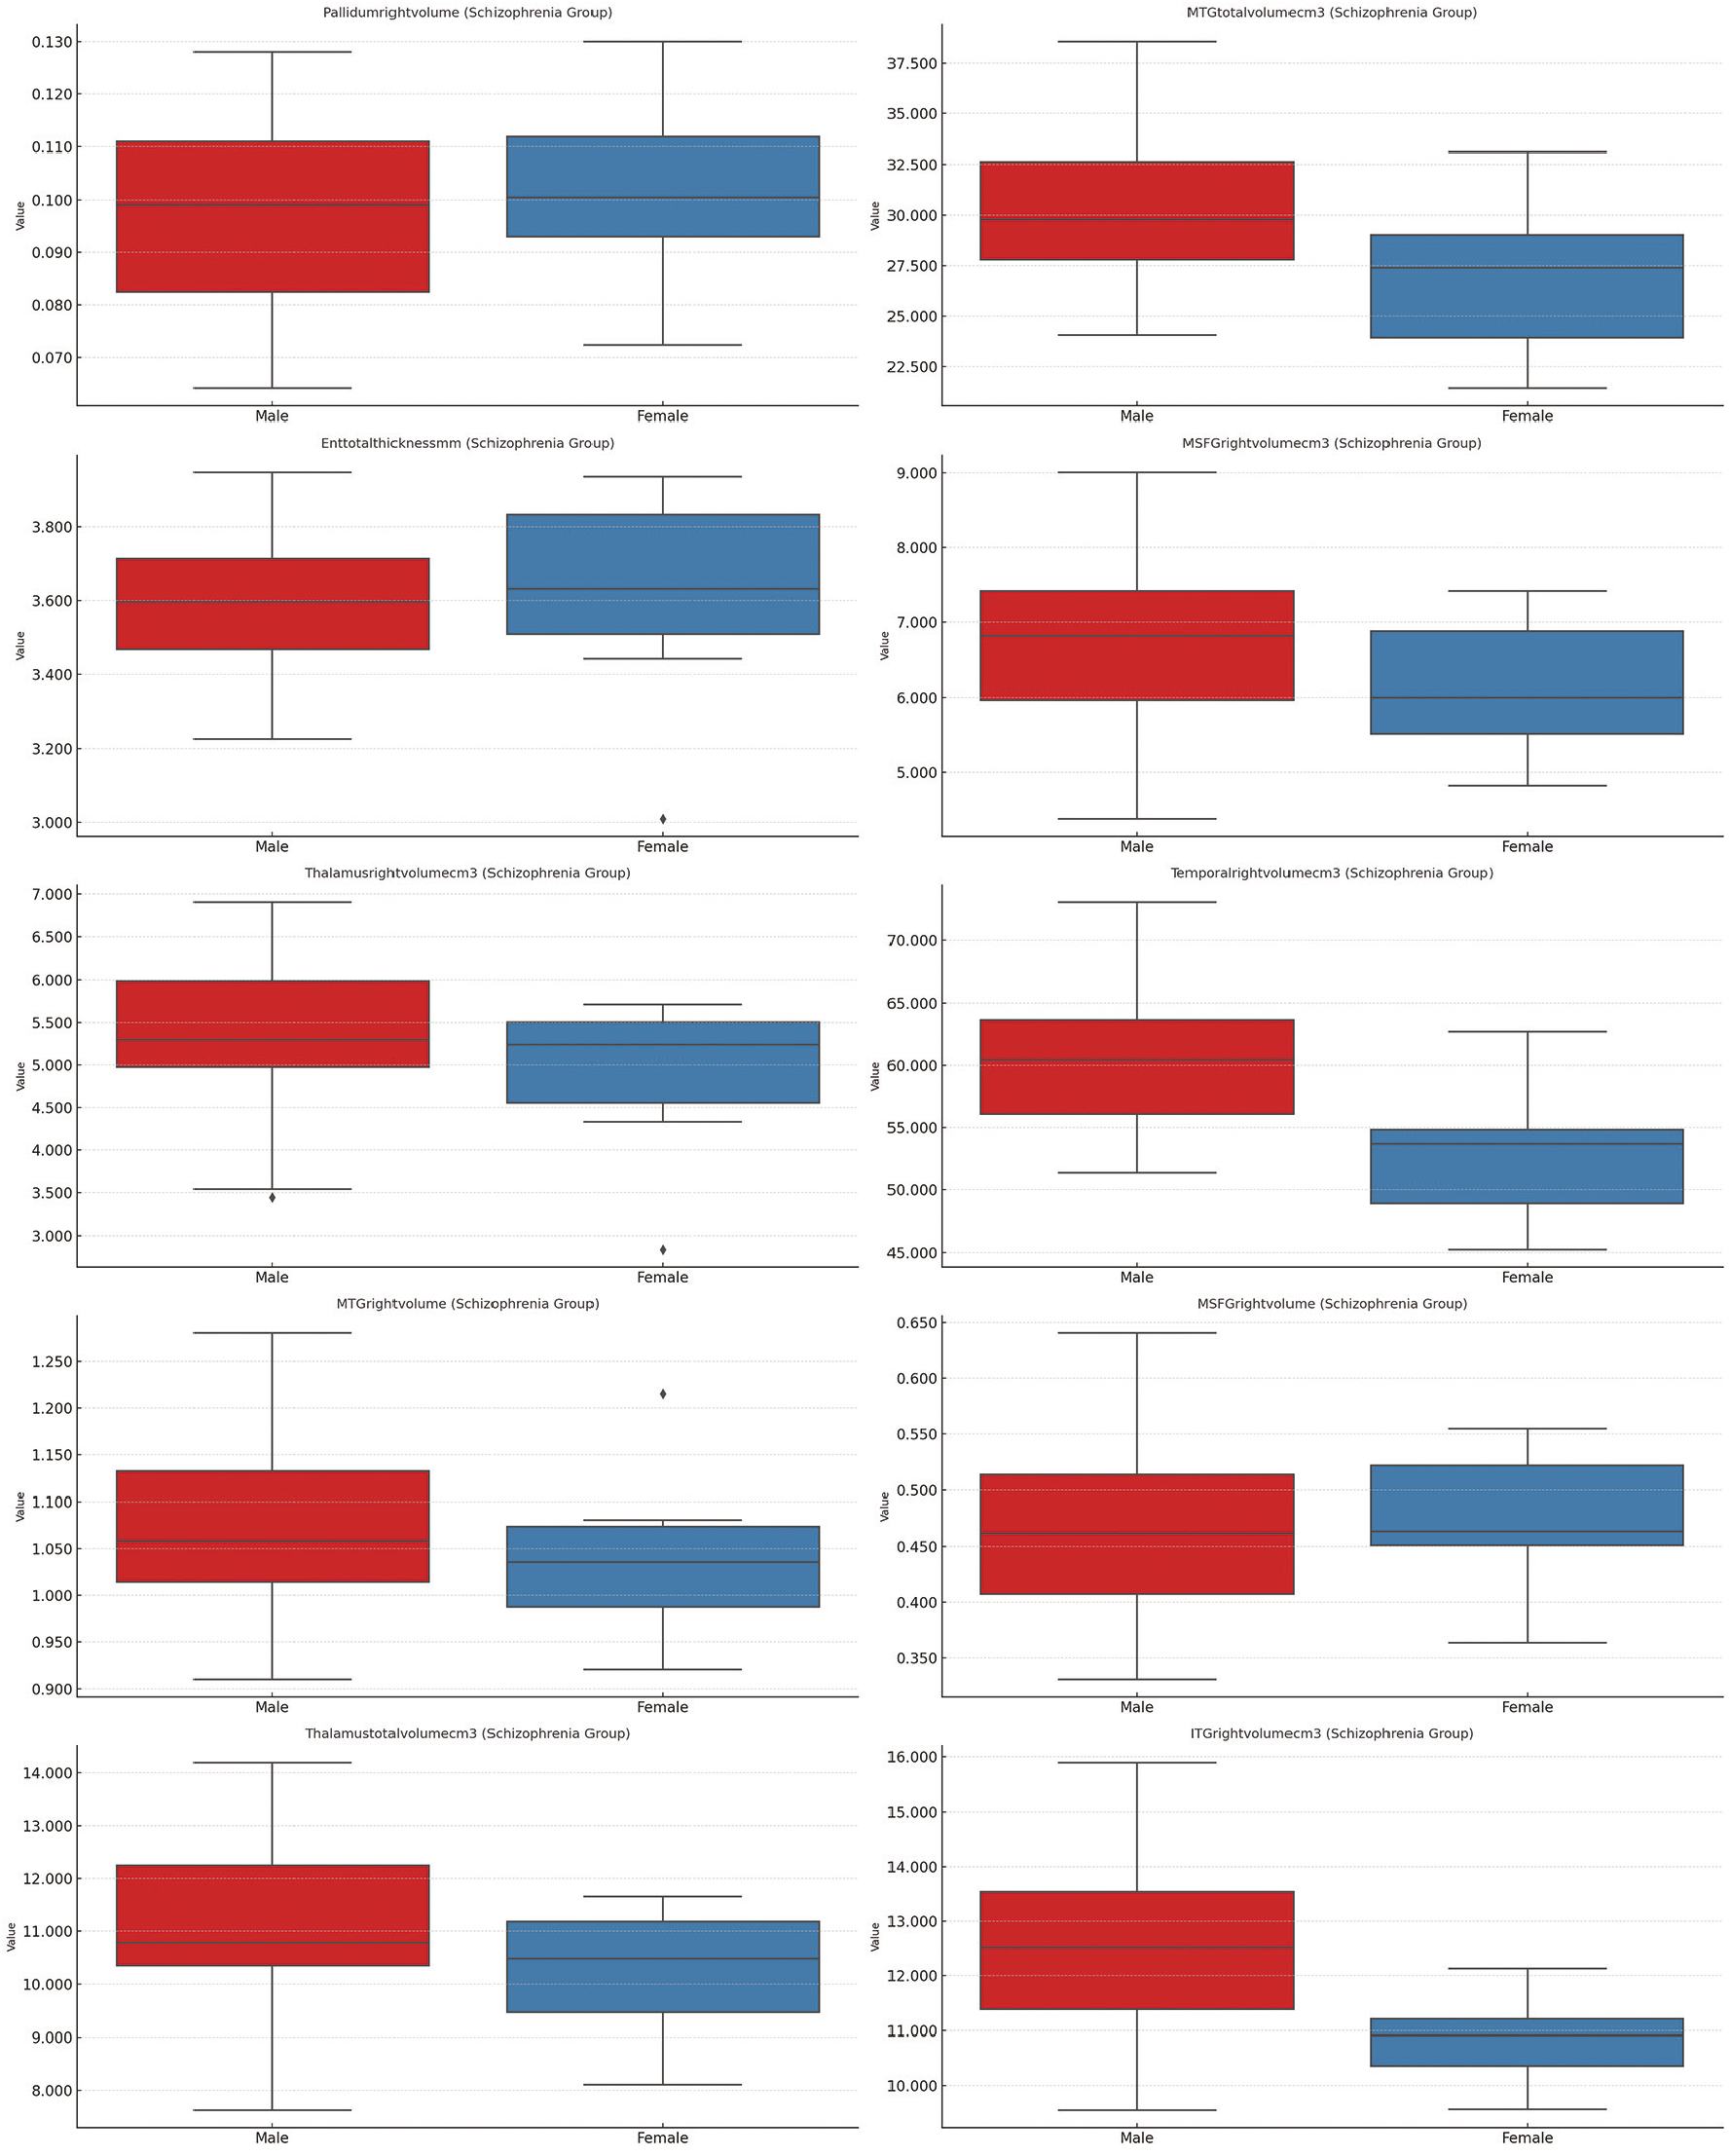
The figure displays boxplots for ten brain regions that showed the most pronounced volumetric or thickness differences between males and females within the schizophrenia group. Each subplot presents one measure, with males represented in red and females in blue. Within each panel, the central line marks the median, the box indicates the interquartile range, and the whiskers depict the broader distribution excluding outliers, which appear as points beyond the whisker boundaries. All axes reflect the original measurement units of each neuroanatomical structure, allowing direct inspection of absolute volume or thickness differences. The consistent layout across regions enables clear comparison of central tendency, variability, and distributional patterns between sexes within the patient cohort, highlighting sex-related divergence in structural characteristics specific to schizophrenia.
Sex differences persist within the schizophrenia cohort, particularly in cerebellar, temporal, and diencephalic regions, suggesting that sex-related neuroanatomical variation remains influential even after accounting for illness effects. These differences may reflect distinct neurodevelopmental trajectories in male and female patients.
No additional sex-related differences were detected beyond the regions listed in and .
Auditory Verbal Hallucination Severity
Significant morphometric differences among hallucination severity levels (mild, moderate, and severe) were identified by one-way ANOVA. Significantly reduced volumes were observed in the left parahippocampal gyrus, bilateral cerebellum, and ventral diencephalon in patients with higher hallucination severity scores (p<0.05) (; and ).
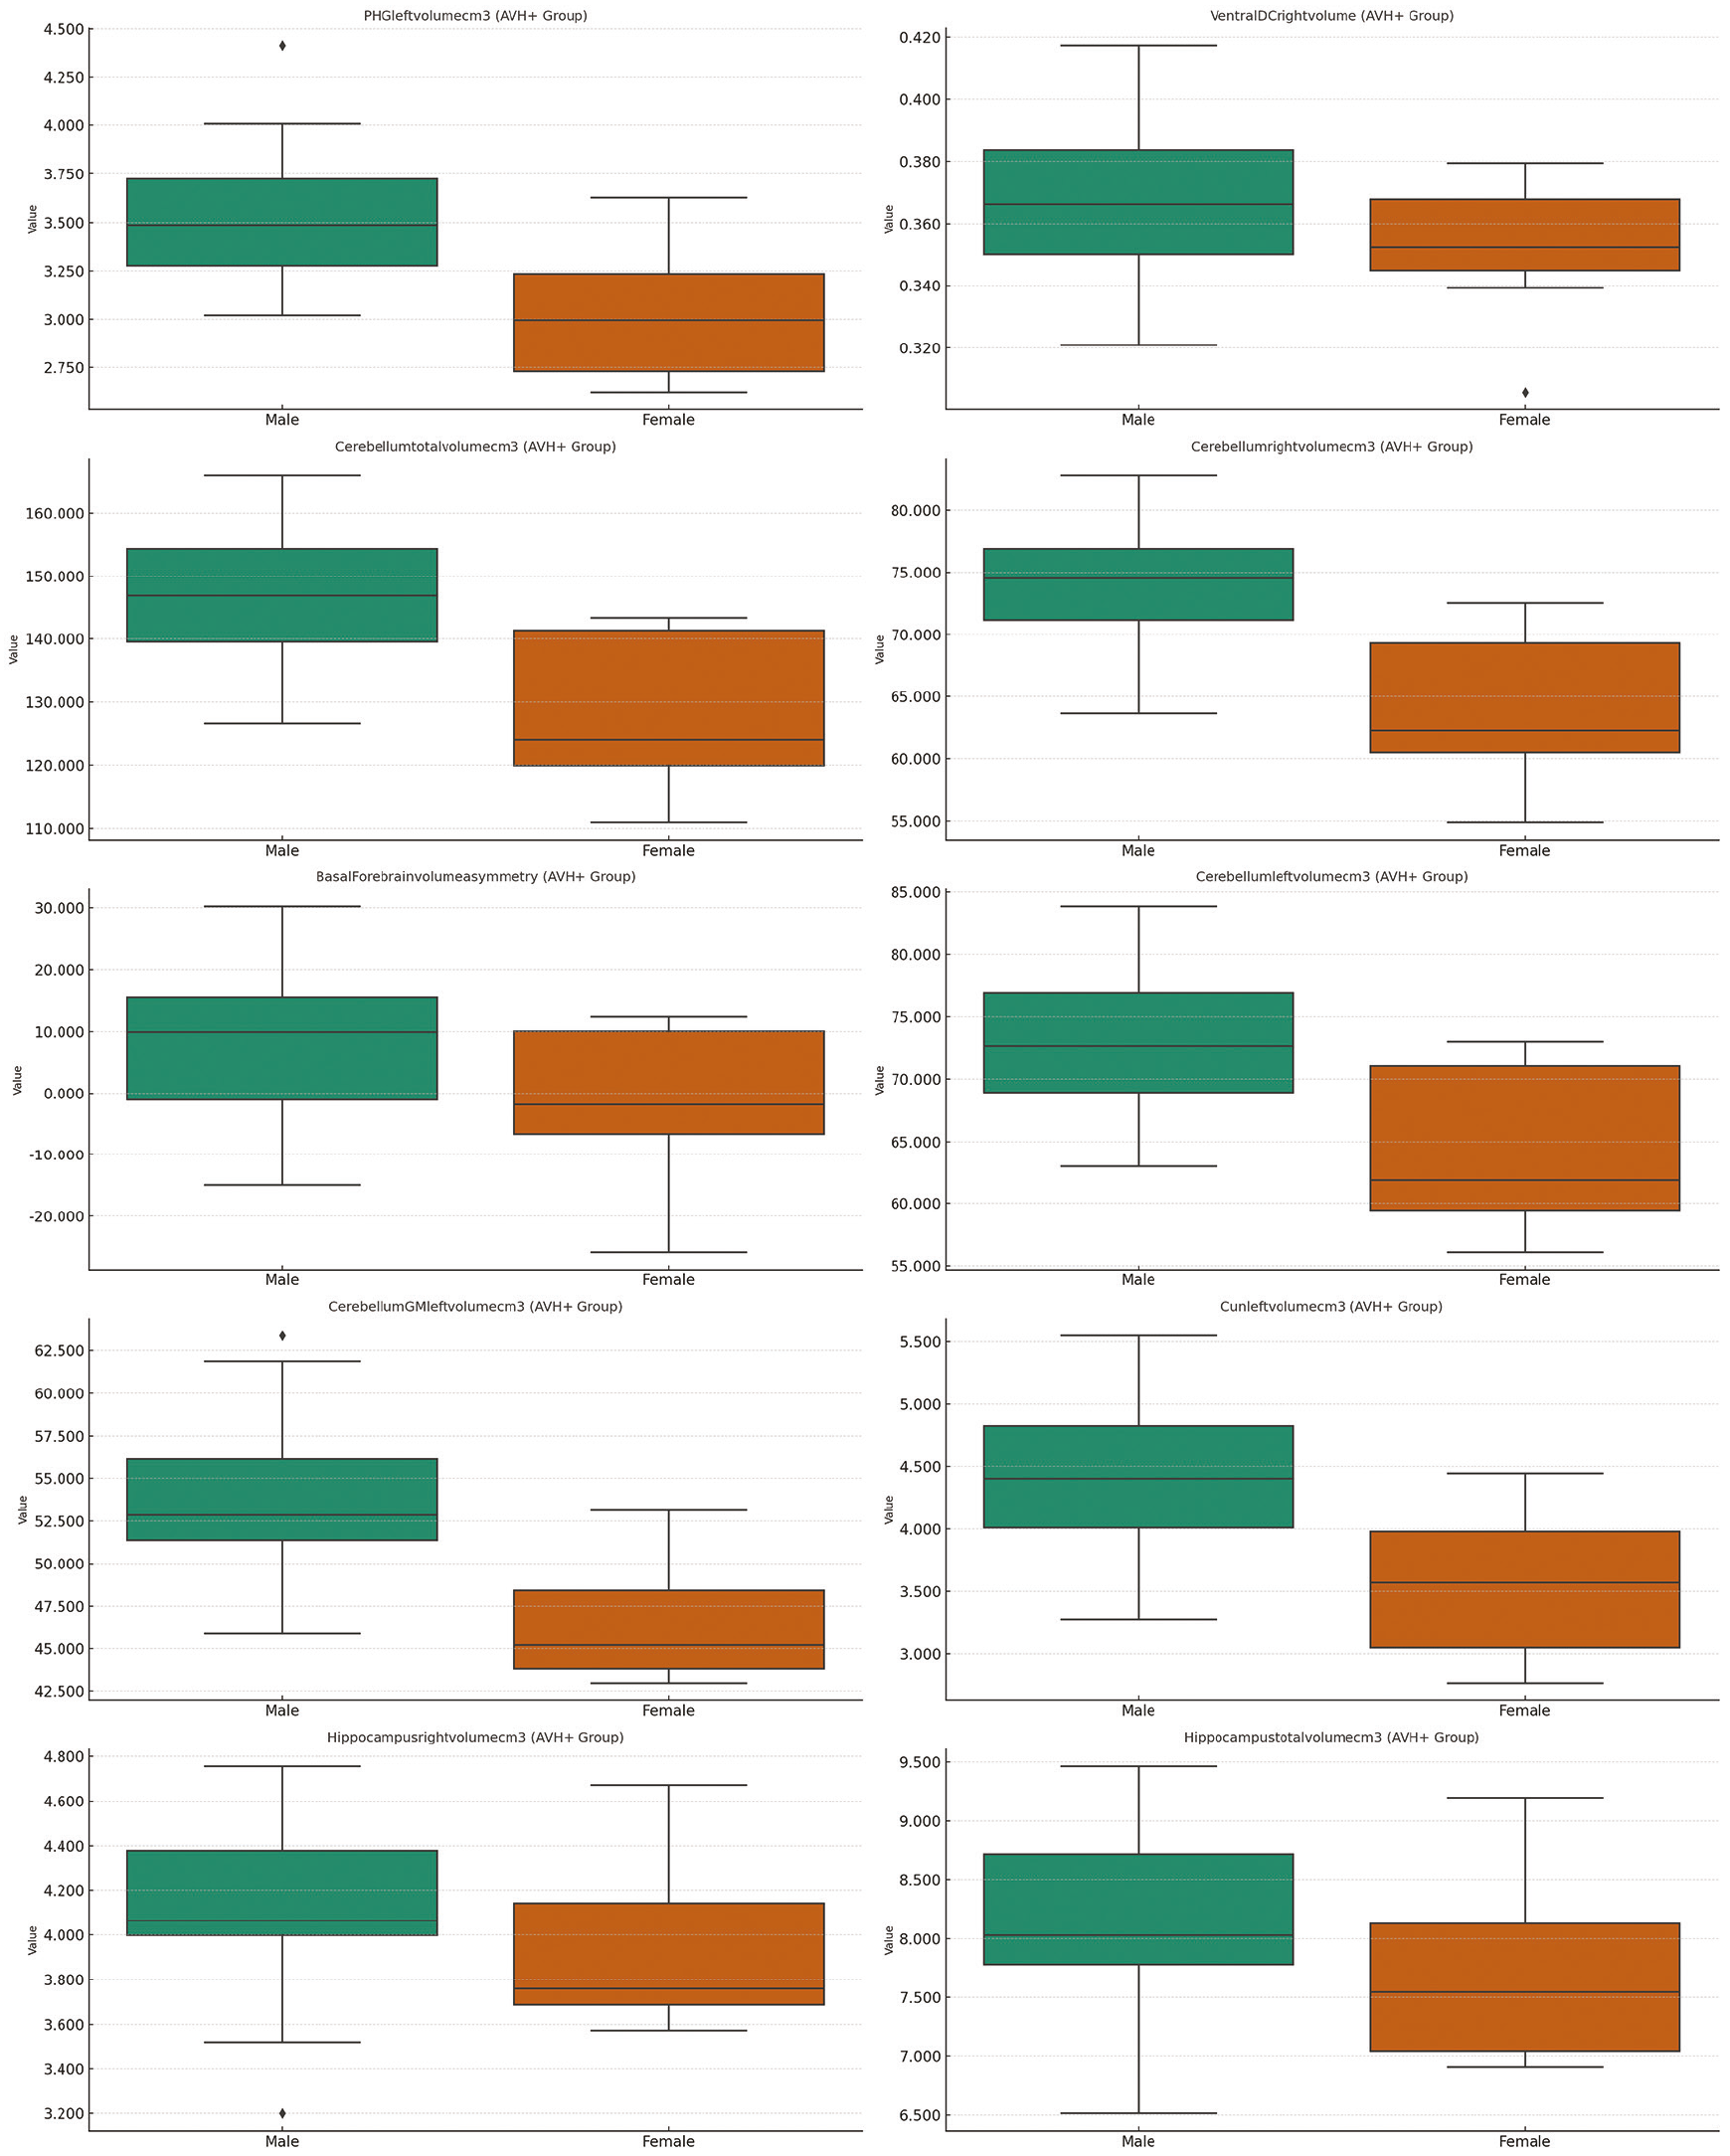
The figure presents boxplots for ten neuroanatomical measures that showed the most notable differences between males and females within the hallucination-positive (AVH+) subgroup of individuals with schizophrenia. Each subplot illustrates the distribution of a single measure, with males shown in green and females shown in orange. Within each panel, the median, interquartile range, and overall spread of values are displayed using standard boxplot elements, allowing direct visualization of central tendency and variability in original measurement units. Outliers are marked as individual points beyond the whiskers. The uniform graphical layout facilitates comparison across regions and demonstrates how sex-related structural variation persists or changes when analyses are limited to patients experiencing auditory verbal hallucinations. The figure thereby provides a focused depiction of sex-linked anatomical patterns within the symptom-defined AVH+ group.
Even among patients experiencing hallucinations, males exhibit larger structural measures in several regions, indicating that sex-related anatomical differences persist within symptom-defined subgroups. This suggests that biological sex may shape the structural substrates that interact with hallucination severity.
AVH: Auditory verbal hallucinations.
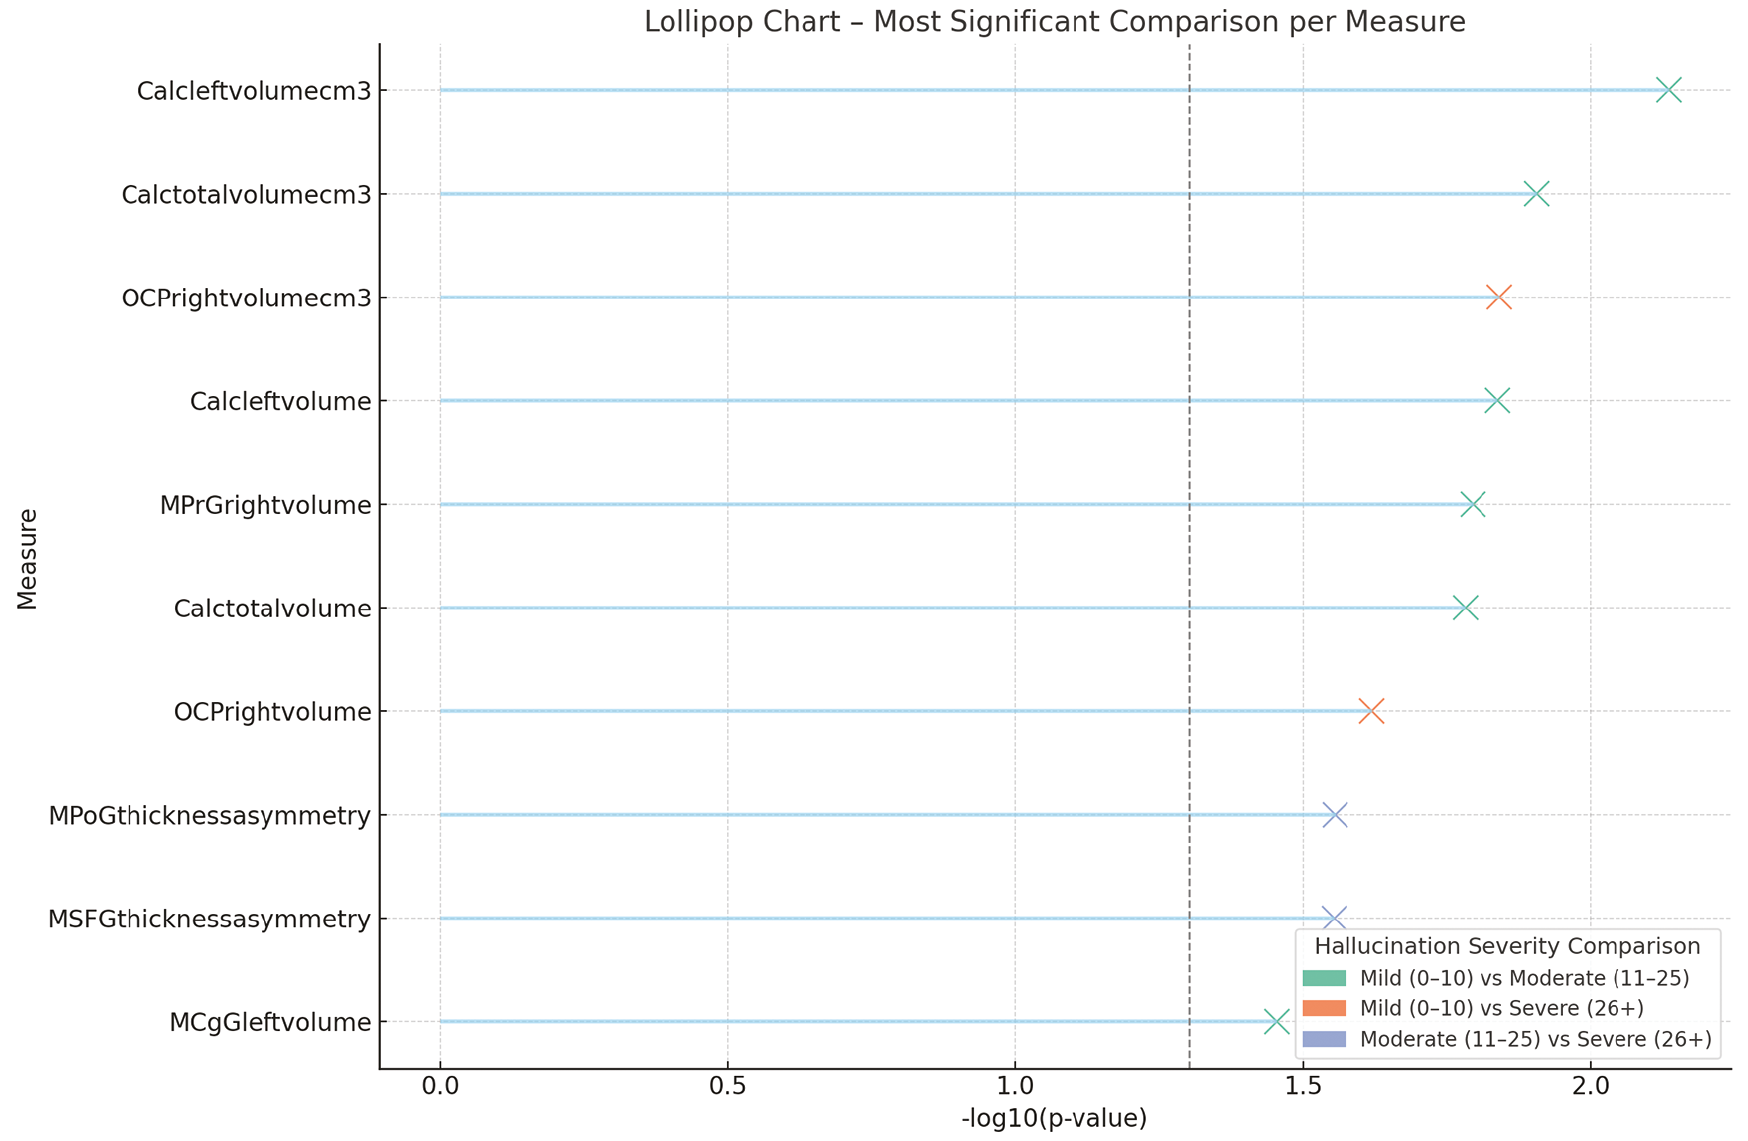
This figure presents, for each neuroanatomical measure, the pairwise hallucination-severity comparison that yielded the strongest statistical result among the three clinical groups. Each measure is displayed on its own horizontal line, with a colored “X” marker placed at the corresponding level of statistical significance on the x-axis, expressed as -log10(p). Marker colors identify which clinical comparison produced the most significant value: green for mild vs. moderate, orange for mild vs. severe, and blue for moderate vs. severe.
A vertical dashed line marks -log10 (p)=1.3, which corresponds approximately to p=0.05, providing a visual reference for conventional significance. Values around -log10 (p)=1.5 correspond to p≈0.03, values near 2.0 indicate p≈0.01, and values above 2.3 correspond to p<0.005. Higher -log10 (p) positions therefore represent increasingly stronger statistical evidence for differences related to hallucination severity.
Several sensory-motor and midline cortical regions show strong severity-related differences, indicating that hallucination intensity is linked to specific structural deviations. The pattern suggests that increasing symptom severity corresponds to more substantial divergence in regions supporting perceptual and self-monitoring processes.
Calc: Calcarine cortex, OCP: Occipital pole, MPrG: Precentral gyrus, MPoG: Postcentral gyrus, MSFG: Medial superior frontal gyrus, MCgG: Middle cingulate gyrus.
Conversely, significantly greater volumes were recorded in several frontal regions, including the middle precentral gyrus, as hallucination severity increased (p<0.05).
No additional severity-related morphometric differences were detected beyond those presented in and and .
Correlations
Several statistically significant correlations between clinical variables and neuroimaging measures were identified across the AVH+ and AVH− subgroups and in the overall sample. As shown in , negative correlations between PSYRATS hallucination scores and multiple morphometric measures were observed in the AVH+ group, including basal forebrain total volume, posterior cingulate gyrus volume asymmetry, middle cingulate gyrus thickness asymmetry, and right Heschl’s gyrus GM volume (r values ranged from -0.371 to -0.300, p<0.05).
This figure displays a correlation heatmap summarizing the associations between auditory verbal hallucination status (AVH+ vs AVH−) and selected volumetric and cortical thickness measures within the schizophrenia group. The heatmap is organized as a rectangular matrix in which each row corresponds to a neuroanatomical region and the column corresponds to the hallucination status variable. Every cell in the matrix represents a Pearson correlation coefficient (r) between AVH status and the structural measurement of that specific region.
Cell color encodes both the direction and magnitude of the correlation. Warm colors (e.g., yellow to red tones) represent positive correlation coefficients, whereas cool colors (e.g., light to dark blue tones) represent negative correlation coefficients. The intensity of the color increases with the absolute value of the coefficient, so cells with stronger correlations (whether positive or negative) appear more saturated, and cells with weak correlations appear closer to a neutral or pale tone. A vertical color bar adjacent to the heatmap provides the numerical scale, allowing visual matching of each color to an approximate r value along a continuous gradient from negative to positive correlations.
Neuroanatomical regions are listed using standardized abbreviations along the axis, enabling rapid identification of which structures were included in the correlation analysis. By scanning horizontally across the matrix, correlation patterns between AVH status and each structural measure can be inspected for sign (warm versus cool) and relative strength (color saturation), while the color bar serves as a reference for interpreting the corresponding correlation magnitude.
The heatmap reveals that hallucination status relates most strongly to variations in cingulate, medial temporal, and prefrontal regions. These structured correlation patterns suggest coherent neuroanatomical differences distinguishing patients with and without hallucinations.
AVH: Auditory verbal hallucinations.
Positive correlations with hallucination severity were recorded in frontal regions, with increased PSYRATS scores corresponding to greater volumes in the left and right superior frontal gyri (r=0.343 and r=0.342, both p<0.05).
Within the AVH− subgroup, lower IQ scores were associated with reduced cortical thickness in limbic structures, including anterior cingulate cortical thickness and total limbic cortical thickness (r=-0.520 and -0.508, both p<0.001).
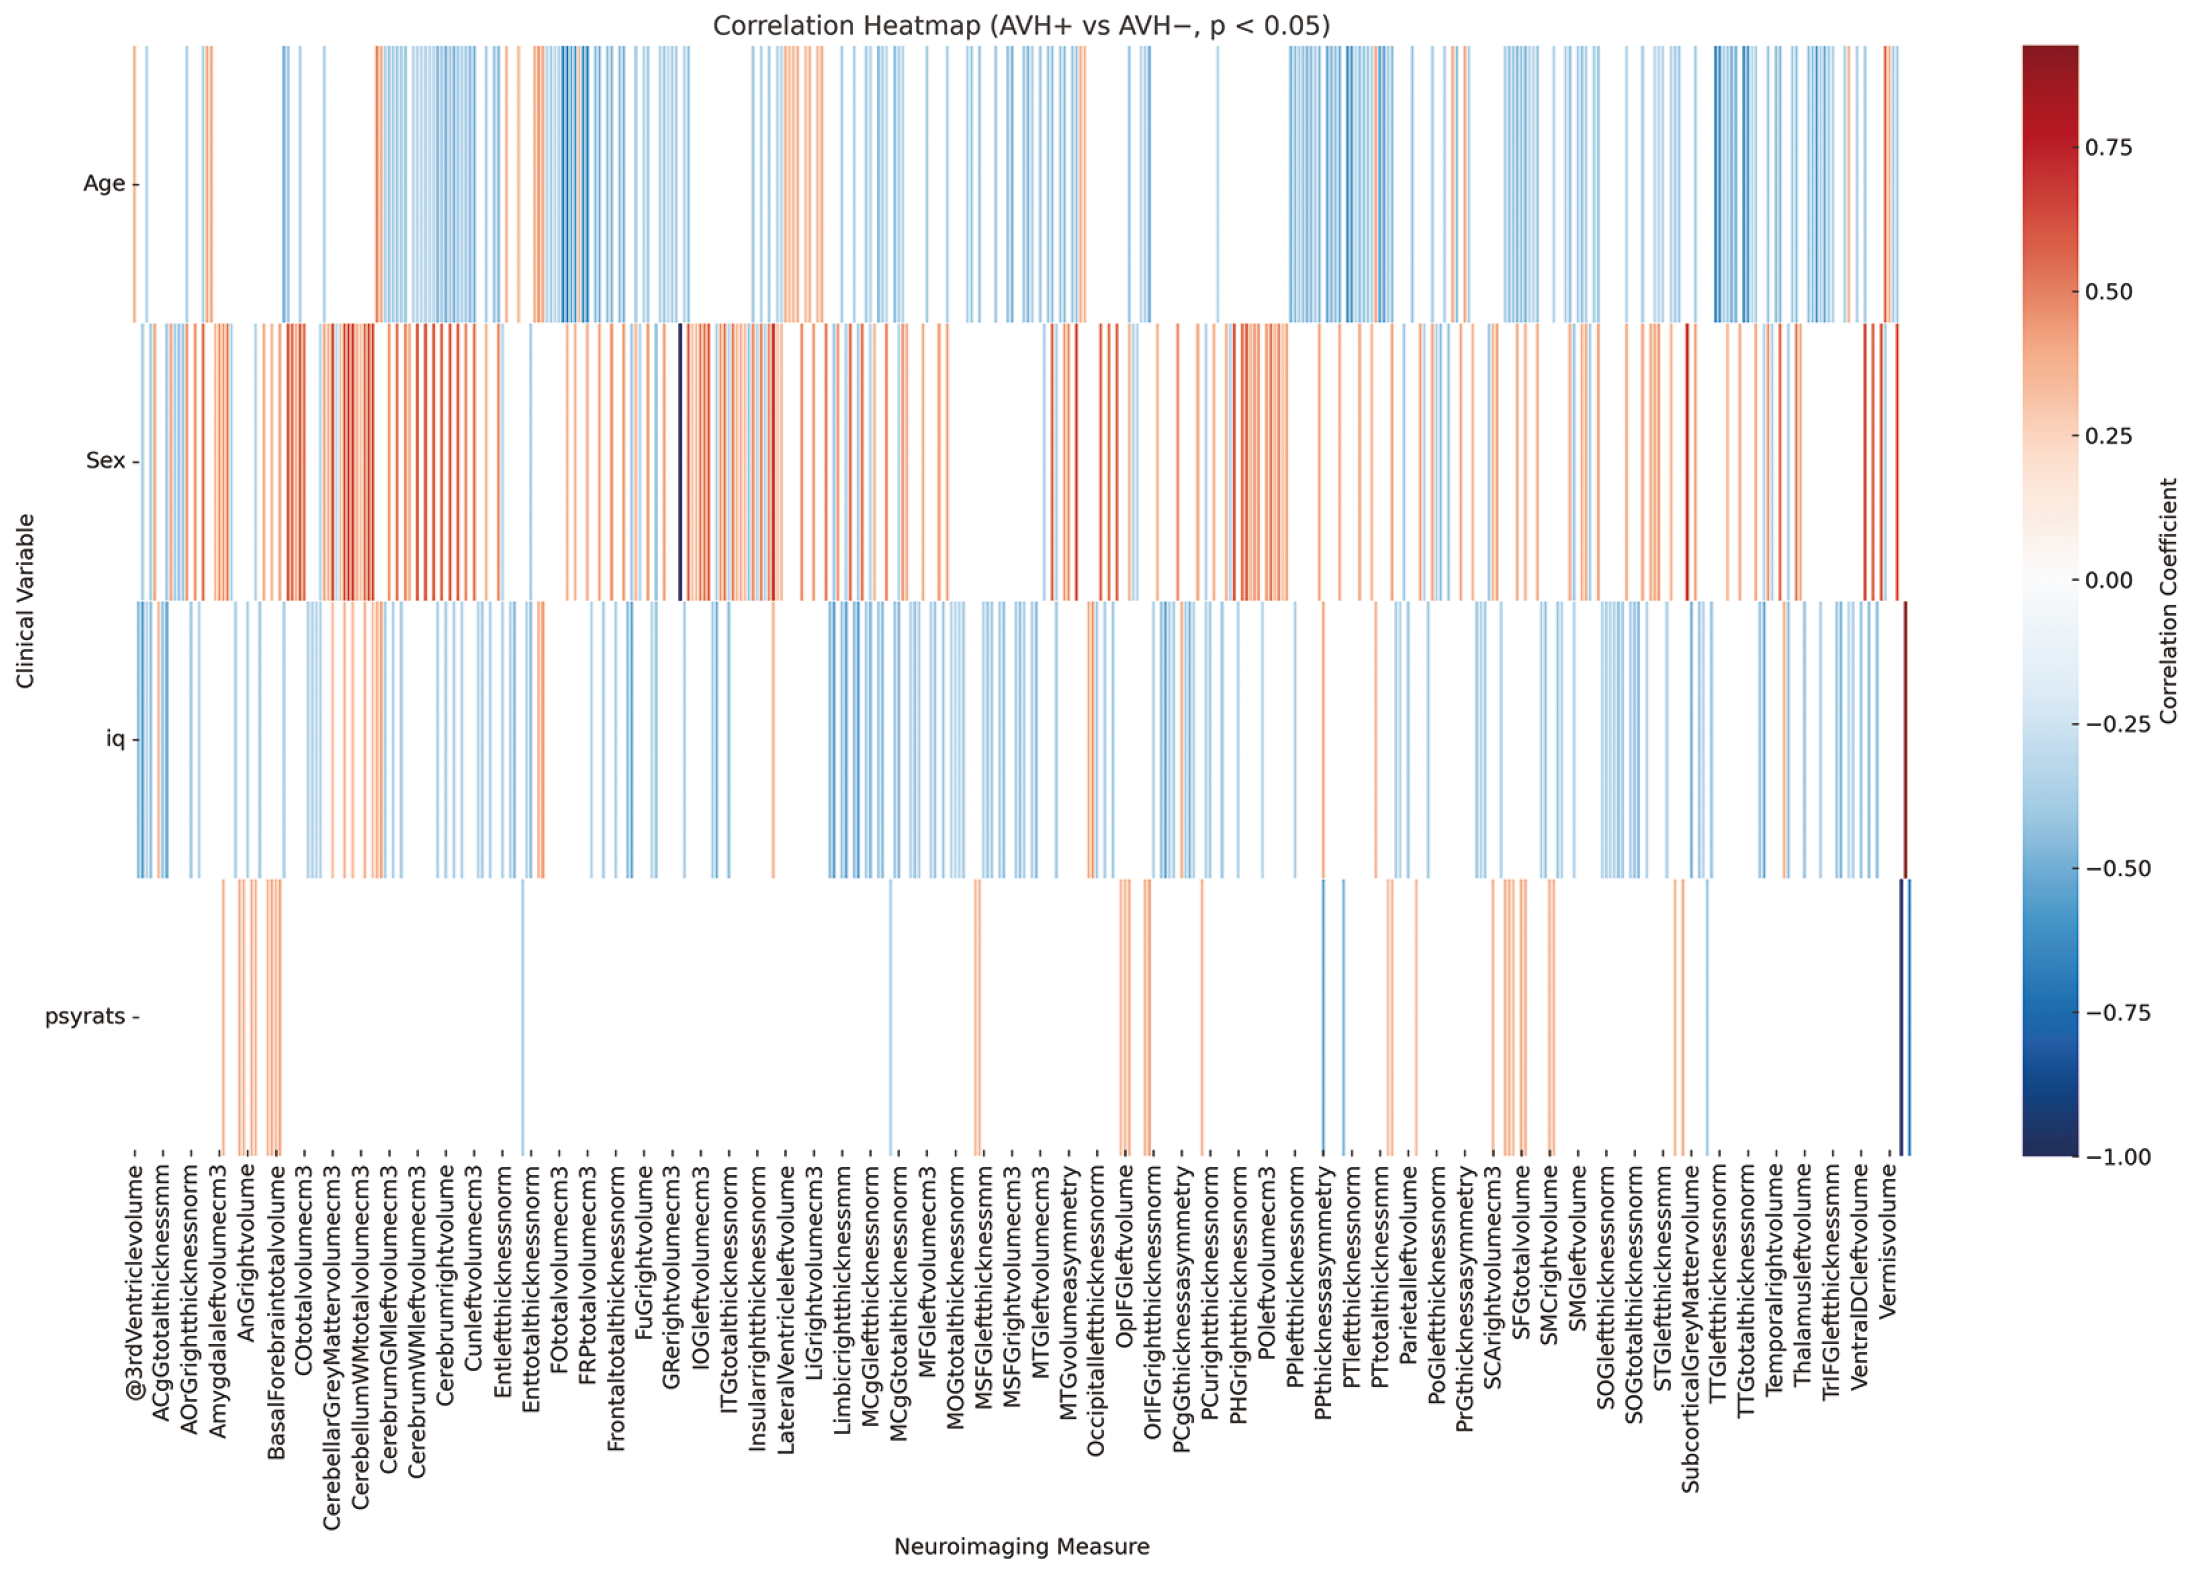
Across the entire sample, sex and age demonstrated the strongest correlations with brain morphology. Male sex was positively correlated with cerebellar GM volume, total cerebellar volume, and parahippocampal gyrus volume (r=0.575-0.603, p<0.001). Age was negatively correlated with cortical thickness and volumes in multiple frontotemporal and thalamic regions, including the left transverse temporal gyrus, planum temporale, and right thalamus (r values ranged from -0.605 to -0.505, p<0.001). These correlations are presented in .
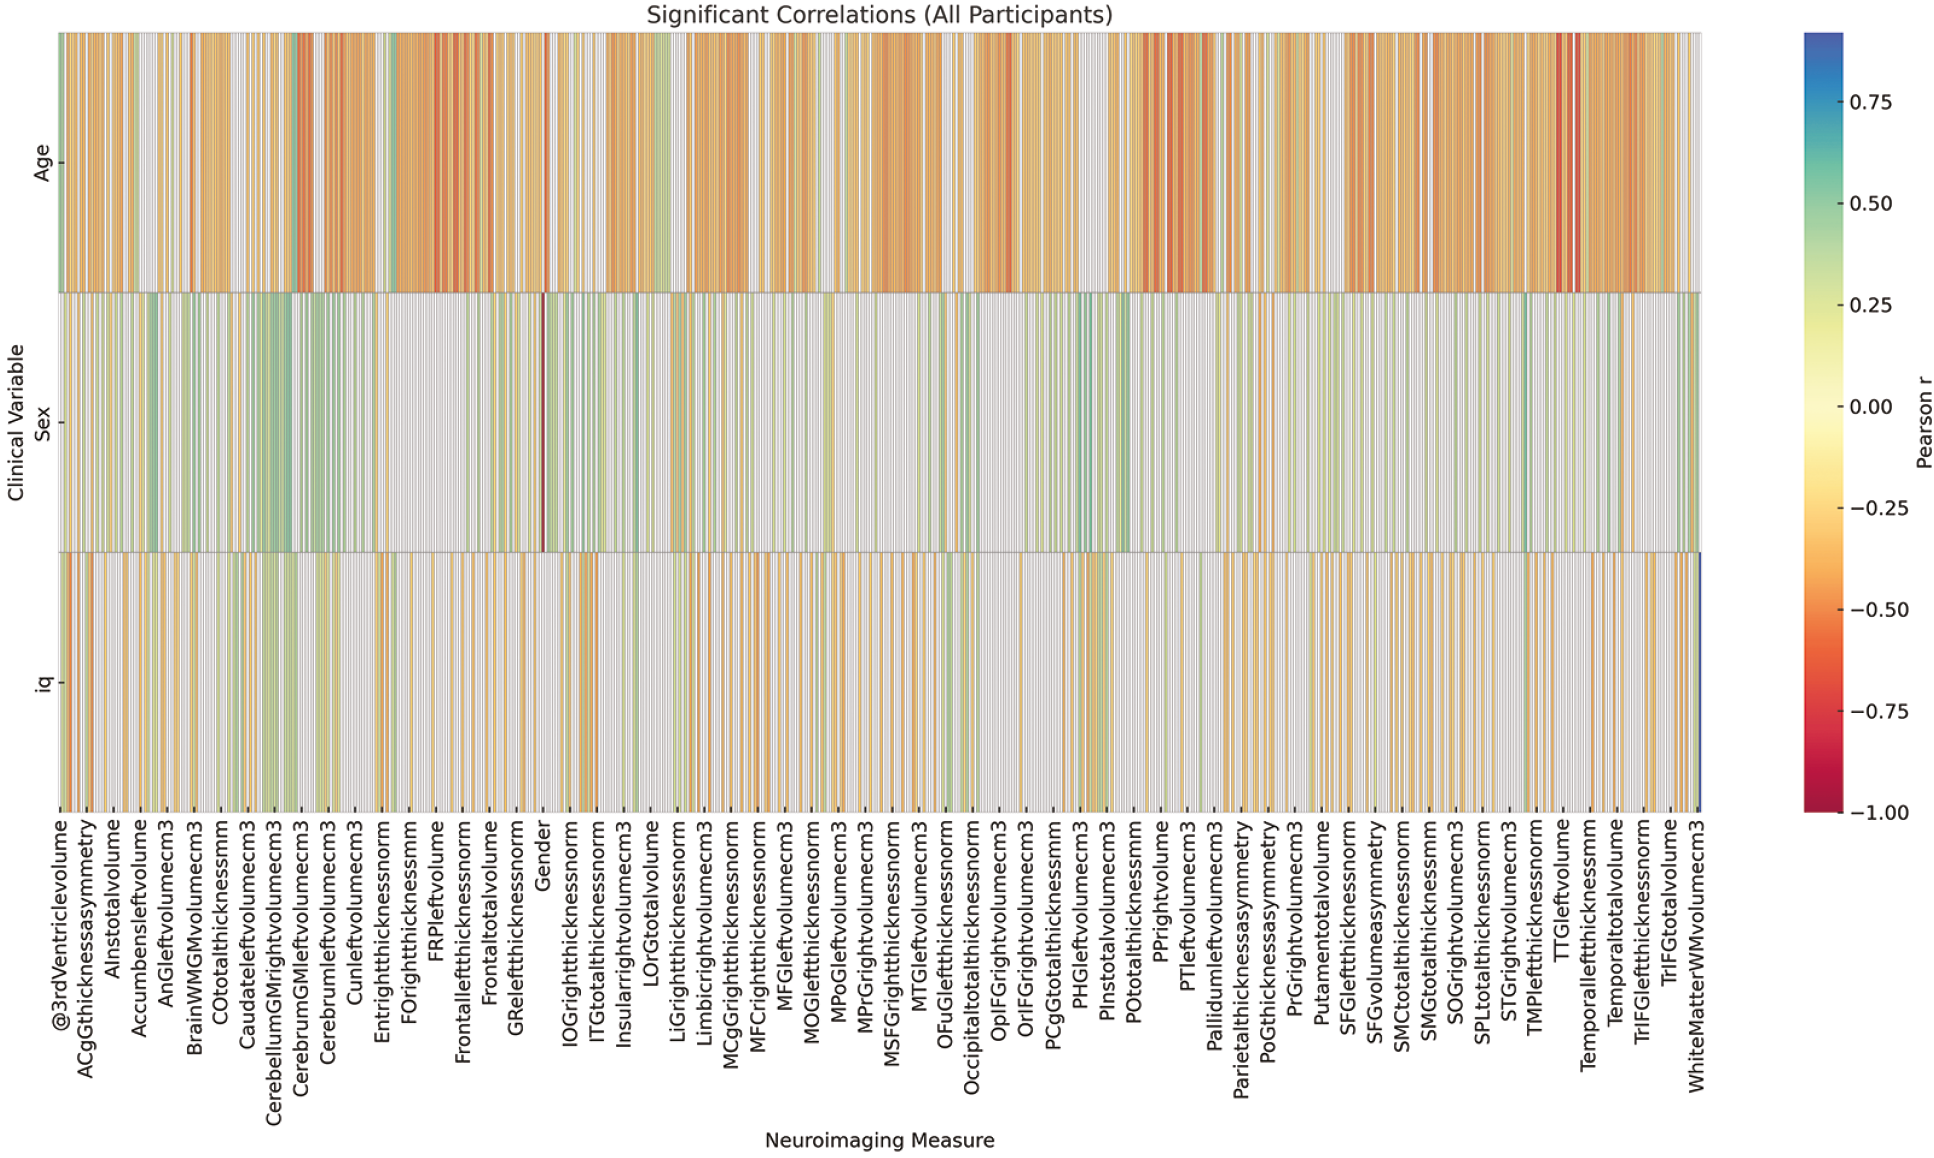
This figure presents a correlation heatmap that summarizes the associations between major demographic variables (age and sex) and the primary volumetric and cortical thickness measures across the entire study sample. The heatmap is arranged as a matrix in which each row corresponds to a specific neuroanatomical region, and each column represents one demographic variable. Each cell of the matrix displays a Pearson correlation coefficient (r) quantifying the association between a given structural measure and either age or sex.
The coloration of each cell encodes both the direction and strength of the correlation. Warm colors (yellow to red) represent positive correlation coefficients, while cool colors (light to dark blue) represent negative coefficients. The saturation level increases as the absolute value of the correlation becomes stronger, allowing visually prominent identification of higher-magnitude associations. A vertical color bar beside the heatmap provides a numerical reference scale, enabling direct comparison between cell color and approximate r values.
Strong positive correlations with sex in several regions reflect expected male-female scaling differences, while age-related patterns show widespread negative associations consistent with normative cortical thinning. These findings validate the expected demographic influences in the dataset and support their inclusion as covariates.
DISCUSSION
The present study systematically examined structural brain differences in schizophrenia using an automated volumetric and cortical thickness analysis pipeline. Three principal findings emerged. First, patients with schizophrenia showed marked reductions in temporal, limbic, thalamic, and medial prefrontal regions compared with healthy controls, accompanied by relative enlargements in select subcortical and cerebellar structures. Second, sex-stratified analyses demonstrated consistently greater global and regional volumes in males across both the total sample and the schizophrenia subgroup. Third, hallucination severity was associated with distinct morphometric variations in basal forebrain, cingulate cortex, cerebellum, and frontal cortex. Correlation analyses further indicated strong moderating effects of age, sex, and cognitive performance on key neuroanatomical measurements. Together, these results provide a coherent overview of the major structural patterns identified in this study and establish the empirical basis for the subsequent comparative interpretation.
Previous neuroimaging studies have consistently reported widespread volumetric reductions in schizophrenia, particularly affecting temporal, frontal, and thalamic regions. In line with these findings, the present study revealed significant reductions in the volumes of the MTG, ITG, thalamus, and MSFG in individuals with schizophrenia compared with healthy controls. These results are concordant with large-scale meta-analyses by Haijma et al. and Wright et al., which demonstrate prominent GM volume reductions in these regions. The observed thalamic volume loss, in particular, aligns with hypotheses of impaired cortico-thalamic connectivity, which have been associated with cognitive and perceptual dysfunctions in schizophrenia.
Moreover, reduced entorhinal cortex volume in our sample is consistent with previous studies reporting limbic system abnormalities in schizophrenia and implicating disrupted memory and contextual processing. The consistent involvement of temporal and medial prefrontal regions across studies strengthens the notion that these areas form part of a core network disrupted in the pathophysiology of schizophrenia.
Interestingly, larger pallidal volumes were identified in the schizophrenia group. Although less frequently reported than volumetric reductions, this pattern has been noted in some meta-analyses and is often interpreted in the context of chronic antipsychotic exposure, which can influence basal ganglia structure. Thus, increased pallidal volume in the present cohort may reflect a combination of disease-related changes and medication-associated neuroplasticity.
Beyond these group-level structural differences, a second major finding of the present study is that sex influences brain morphology in both the total sample and the schizophrenia subgroup. Consistent and robust sex-related effects were identified, with males demonstrating greater global and regional brain volumes than females, a pattern that has been widely reported in large normative neuroimaging cohorts., These volumetric differences were most pronounced in cerebellar and parahippocampal regions in our dataset, suggesting sex-dependent variation in neural systems supporting coordination, memory, and associative processing.
Within the schizophrenia group, these effects remained evident: males exhibited larger volumes of cerebellar GM, hippocampal structures, and the ventral diencephalon. Such findings align with the literature indicating sex-specific neurodevelopmental trajectories in schizophrenia, with males showing more pronounced alterations in subcortical and fronto-cerebellar pathways. These pathways have been associated with executive function, sensorimotor integration, and cognitive flexibility, all of which are frequently affected in schizophrenia.
However, prior studies have reported the opposite trend, suggesting relatively preserved frontal lobe morphology in female patients compared with males. The discrepancy between our findings and those reports may stem from sample characteristics, including variability in illness duration, exposure to antipsychotic medication and demographic composition. Such heterogeneity underscores the importance of sex-stratified analyses when examining structural brain changes in schizophrenia and highlights the need for longitudinal studies to clarify whether these differences reflect neurodevelopmental divergence, symptom burden, or treatment factors.
In addition to sex-related variation, a third key finding of the present study is the association between AVH severity and regional brain morphology within the schizophrenia group. Several volumetric and asymmetry-related alterations were systematically associated with symptom severity, indicating that AVH may arise from specific disruptions in limbic, paralimbic, and associative networks. Higher PSYRATS scores were associated with reduced basal forebrain volume and greater asymmetry in the posterior and middle cingulate cortices-regions involved in salience processing, attention allocation, and integration of internal and external stimuli., These associations converge with theoretical models proposing that hallucinations reflect aberrant attribution of relevance to internally generated sensory experiences.
Notably, increases in superior frontal gyrus volume were also associated with greater hallucination severity. Although this pattern may initially appear counterintuitive, similar findings have been reported in functional and structural neuroimaging studies, suggesting that prefrontal enlargement may reflect maladaptive compensatory mechanisms or inefficient recruitment of cognitive-control systems during internally generated speech processing. The precise functional meaning of this morphological increase remains uncertain, but its consistency across studies highlights the complexity of prefrontal involvement in AVH pathophysiology.
Moreover, hallucination severity was associated with volumetric reductions in the cerebellar and parahippocampal regions. These structures are implicated in sensory prediction, memory integration, and temporal sequencing-functions that are increasingly recognized as central to the emergence of hallucinatory experiences. The cerebellum, in particular, has been proposed to modulate internal forward models of perception; thus, its reduced volume in more severe AVH presentations may contribute to an impaired ability to distinguish self-generated from externally originating stimuli.
Taken together, the structural correlates of hallucination severity identified in this study support the view that AVH arises from interactions across distributed neural circuits, including limbic, cingulate, cerebellar, and prefrontal pathways. These findings further demonstrate the utility of stratifying patients by symptom severity, as group-level comparisons alone may obscure symptom-specific morphometric signatures critical for understanding the heterogeneity of schizophrenia.
In addition to these volumetric patterns, several differences in cortical thickness were identified, providing further insight into the regional specificity of structural alterations in schizophrenia., The most prominent reductions were observed in auditory, limbic, and paralimbic cortices, including the transverse temporal gyrus, entorhinal cortex, and planum temporale-regions critically involved in auditory processing, memory integration, and language perception. These findings align with prior surface-based morphometry studies that report widespread cortical thinning in schizophrenia, particularly in the temporal and prefrontal regions., The involvement of the left transverse temporal gyrus, which contains the primary auditory cortex, is especially notable given its established relevance to abnormalities in source monitoring and inner speech processing.
Cortical thinning in the entorhinal cortex, observed in the present study, further supports evidence for medial temporal lobe vulnerability in schizophrenia. This region contributes to episodic memory, contextual binding, and spatial navigation; reduced thickness has been associated with impaired memory encoding and organizational deficits in both early-stage and chronic illnesses., The convergence of our findings with prior anatomical and functional literature reinforces the view that medial temporal structures form a central component of the structural substrate affected in schizophrenia.
Although thinning predominated across most cortical regions, increased thickness or volume in the superior frontal gyrus was observed among patients with more severe hallucinations. This pattern mirrors the volumetric findings described above and has been reported in several previous studies, which suggest that prefrontal hypertrophy may reflect maladaptive plasticity or inefficient compensatory mechanisms within cognitive control networks., The coexistence of thinning in temporal and paralimbic regions with focal increases in prefrontal measures underscores the heterogeneous and regionally differentiated nature of cortical alterations linked to both diagnosis and symptom severity.
Age and sex also exerted measurable effects on cortical thickness across the sample. Consistent with the normative neuroimaging literature, increasing age was associated with diffuse cortical thinning, particularly in auditory and frontal cortices. Sex differences were less prominent for thickness measures than for volumetric indices, but were nevertheless evident in several temporal and frontal regions. These demographic influences highlight the importance of adjusting morphometric analyses for age and sex, especially in symptom-stratified research.
Collectively, the cortical thickness findings presented here emphasize that schizophrenia involves not only widespread volumetric changes but also selective alterations in cortical microstructure. The overlap between thickness reductions in auditory and medial temporal areas and the networks implicated in hallucination severity provides further support for distributed, circuit-level models of symptom expression in schizophrenia. In line with this interpretation, structural anomalies suggest disrupted integration across the salience, auditory, and language networks. Findings support the hypothesis that auditory hallucinations arise from widespread yet anatomically consistent patterns of neuroanatomical disconnection.
These observations contextualize the structural patterns identified in this study and provide a basis for considering the methodological and analytical strengths of the present work.
While the present analysis focuses on structural MRI measures, it is important to note that advanced neuroimaging modalities such as diffusion tensor imaging (DTI) and functional MRI (fMRI) offer complementary avenues for further investigation. DTI enables detailed characterization of WM integrity and network-level disconnection patterns, while fMRI captures alterations in intrinsic functional connectivity within salience, auditory, and language networks-systems directly relevant to the mechanisms of AVH. Incorporating these modalities into future research would allow for a more comprehensive and multimodal understanding of the distributed structural-functional disruptions suggested by the present volumetric and cortical thickness results.
An important strength of the present study is the use of a publicly accessible and well-characterized neuroimaging dataset, which enhances transparency, reproducibility, and comparability across studies. Application of a fully automated and validated segmentation pipeline (vol2Brain) minimized operator bias and enabled high-resolution quantification of over 100 anatomically defined regions, resulting in a comprehensive morphometric profile. Furthermore, the analytic design incorporated multiple complementary levels of comparison-including diagnostic status, sex, and hallucination severity-ogether with correlation analyses that linked structural measures to demographic and clinical variables. This multidimensional framework enabled a more refined characterization of the structural heterogeneity of schizophrenia than would have been possible through group comparisons alone.
Study Limitations
Despite these strengths, several limitations merit consideration. The sample size within specific schizophrenia subgroups, particularly among female patients with severe hallucinations, was modest, which may limit the generalizability of findings specific to these subgroups. Although automated segmentation provides consistency, the absence of manual correction can be a constraint in cases where motion artifacts or atypical anatomy are present. The cross-sectional design precludes causal inferences regarding whether observed morphological differences represent preexisting vulnerability, illness progression, or medication effects. While the PSYRATS scale offers a detailed assessment of hallucination severity, it does not capture the full spectrum of psychotic symptoms or cognitive deficits that may influence brain structure. Finally, although multiple comparisons were addressed by focusing interpretation on clinically meaningful results, the large number of regions examined raises the possibility of Type I error, highlighting the need for future replication in larger cohorts.
CONCLUSION
This study provides a multidimensional overview of structural brain alterations in schizophrenia, identifying volumetric and cortical differences tied to diagnosis, sex, and hallucination severity. Automated high-resolution segmentation revealed abnormalities in temporal, limbic, cerebellar, and prefrontal circuits, which may contribute to disturbances in auditory processing, emotional regulation, and self-monitoring. These findings accord with prior large-scale research and may extend current knowledge by highlighting symptom- and sex-specific morphometric variation within the disorder. Overall, the results indicate that structural neuroimaging may provide reproducible and clinically meaningful markers of the neuroanatomical alterations observed in schizophrenia. Future longitudinal and multimodal studies may clarify how such structural alterations emerge and how they may influence the progression of clinical symptoms.
MAIN POINTS
• Auditory hallucinations in schizophrenia are associated with specific regional volumetric alterations in the superior temporal gyrus and the insular cortex.
• Volumetric reductions were observed in auditory-language hubs, particularly within Heschl’s gyrus and the planum temporale.
• Limbic-paralimbic structures, such as the insula and parahippocampus, also exhibited significant asymmetry and volume changes in patients.
• Structural anomalies suggest disrupted integration across the salience, auditory, and language networks.
• Findings support the hypothesis that auditory hallucinations are grounded in widespread, but anatomically consistent, neuroanatomical disconnection patterns.
Footnotes
Ethics
Ethics Committee Approval: Ethical approval for secondary data analysis was obtained from the Kafkas University Faculty of Medicine Research Ethics Committee (approval number: 2025/04/10, date: 30.04.2025).
Informed Consent: Not applicable.
Acknowledgements
The authors would like to express their sincere gratitude to all participants, especially the individuals living with schizophrenia, whose willingness to share their time and experiences made this research possible. Their invaluable contribution not only advances scientific understanding but also reflects a profound commitment to helping others through research. We are truly indebted to their participation and generosity. We are also deeply grateful to Prof. Dr. Ali Saffet Gönül, a distinguished faculty member of the Affective Disorders Unit at the Ege University Faculty of Medicine Department of Psychiatry. His thoughtful insights and clinical expertise provided valuable guidance during the interpretation of neuropsychiatric relevance in this study, enriching the depth and translational relevance of our findings. Our appreciation further extends to the original data contributors and the OpenNeuro platform for fostering open science and enabling collaborative research across disciplines.
Authorship Contributions
Concept: A.B.K., Y.A., Design: A.B.K., Y.A., Data Collection and/or Processing: A.B.K., Analysis and/or Interpretation: A.B.K., Literature Search: A.B.K., Writing: A.B.K.
Conflict of Interest: No conflict of interest was declared by the authors.
Financial Disclosure: The authors declared that this study received no financial support.
References
Tandon R, Nasrallah HA, Keshavan MS. Schizophrenia, “just the facts” 5. Treatment and prevention. Past, present, and future. Schizophr Res. 2010; 122(1-3): 1-23.
McGrath J, Saha S, Chant D, Welham J. Schizophrenia: a concise overview of incidence, prevalence, and mortality. Epidemiol Rev. 2008; 30: 67-76.
Waters F, Allen P, Aleman A, Fernyhough C, Woodward TS, Badcock JC, et al. Auditory hallucinations in schizophrenia and nonschizophrenia populations: a review and integrated model of cognitive mechanisms. Schizophr Bull. 2012; 38(4): 683-93.
Jardri R, Pouchet A, Pins D, Thomas P. Cortical activations during auditory verbal hallucinations in schizophrenia: a coordinate-based meta-analysis. Am J Psychiatry. 2011; 168(1): 73-81.
Modinos G, Costafreda SG, van Tol MJ, McGuire PK, Aleman A, Allen P. Neuroanatomy of auditory verbal hallucinations in schizophrenia: a quantitative meta-analysis of voxel-based morphometry studies. Cortex. 2013; 49(4): 1046-55.
Shinn AK, Pfaff D, Young S, Lewandowski KE, Cohen BM, Öngür D. Auditory hallucinations in a cross-diagnostic sample of psychotic disorder patients: a descriptive, cross-sectional study. Compr Psychiatry. 2012; 53(6): 718-26.
Hutton C, Draganski B, Ashburner J, Weiskopf N. A comparison between voxel-based cortical thickness and voxel-based morphometry in normal aging. Neuroimage. 2009; 48(2): 371-80.
Winkler AM, Kochunov P, Blangero J, Almasy L, Zilles K, Fox PT, et al. Cortical thickness or grey matter volume? The importance of selecting the phenotype for imaging genetics studies. Neuroimage. 2010; 53(3): 1135-46.
Manjón JV, Coupé P. volBrain: an online MRI brain volumetry system. Front Neuroinform. 2016; 10: 30.
Soler-Vidal J, Fuentes-Claramonte P, Salgado-Pineda P, Ramiro N, García-León MÁ, Torres ML, et al. Brain correlates of speech perception in schizophrenia patients with and without auditory hallucinations. PLoS One. 2022; 17(12): e0276975.
Haijma SV, Van Haren N, Cahn W, Koolschijn PC, Hulshoff Pol HE, Kahn RS. Brain volumes in schizophrenia: a meta-analysis in over 18 000 subjects. Schizophr Bull. 2013; 39(5): 1129-38.
Wright IC, Rabe-Hesketh S, Woodruff PW, David AS, Murray RM, Bullmore ET. Meta-analysis of regional brain volumes in schizophrenia. Am J Psychiatry. 2000; 157(1): 16-25.
Thielen JW, Müller BW, Chang DI, Krug A, Mehl S, Rapp A, et al. Cortical thickness across the cingulate gyrus in schizophrenia and its association to illness duration and memory performance. Eur Arch Psychiatry Clin Neurosci. 2022; 272(7): 1241-51.
Honea R, Crow TJ, Passingham D, Mackay CE. Regional deficits in brain volume in schizophrenia: a meta-analysis of voxel-based morphometry studies. Am J Psychiatry. 2005; 162(12): 2233-45.
Wise T, Radua J, Via E, Cardoner N, Abe O, Adams TM, et al. Common and distinct patterns of grey-matter volume alteration in major depression and bipolar disorder: evidence from voxel-based meta-analysis. Mol Psychiatry. 2017; 22(10): 1455-63.
Ford JM, Roach BJ, Jorgensen KW, Turner JA, Brown GG, Notestine R, et al. Tuning in to the voices: a multisite FMRI study of auditory hallucinations. Schizophr Bull. 2009; 35(1): 58-66.
Forbes NF, Carrick LA, McIntosh AM, Lawrie SM. Working memory in schizophrenia: a meta-analysis. Psychol Med. 2009; 39(6): 889-905.
Allen P, Larøi F, McGuire PK, Aleman A. The hallucinating brain: a review of structural and functional neuroimaging studies of hallucinations. Neurosci Biobehav Rev. 2008; 32(1): 175-91.
Plaze M, Bartrés-Faz D, Martinot JL, Januel D, Bellivier F, De Beaurepaire R, et al. Left superior temporal gyrus activation during sentence perception negatively correlates with auditory hallucination severity in schizophrenia patients. Schizophr Res. 2006; 87(1-3): 109-15.
Xie Y, Zhang T, Ma C, Guan M, Li C, Wang L, et al. The underlying neurobiological basis of gray matter volume alterations in schizophrenia with auditory verbal hallucinations: a meta-analytic investigation. Prog Neuropsychopharmacol Biol Psychiatry. 2025; 138: 111331.
van Erp TGM, Walton E, Hibar DP, Schmaal L, Jiang W, Glahn DC, et al. Cortical brain abnormalities in 4474 individuals with schizophrenia and 5098 control subjects via the enhancing neuro imaging genetics through meta analysis (ENIGMA) consortium. Biol Psychiatry. 2018; 84(9): 644-54.
Sone M, Koshiyama D, Zhu Y, Maikusa N, Okada N, Abe O, et al. Structural brain abnormalities in schizophrenia patients with a history and presence of auditory verbal hallucination. Transl Psychiatry. 2022; 12(1): 511.